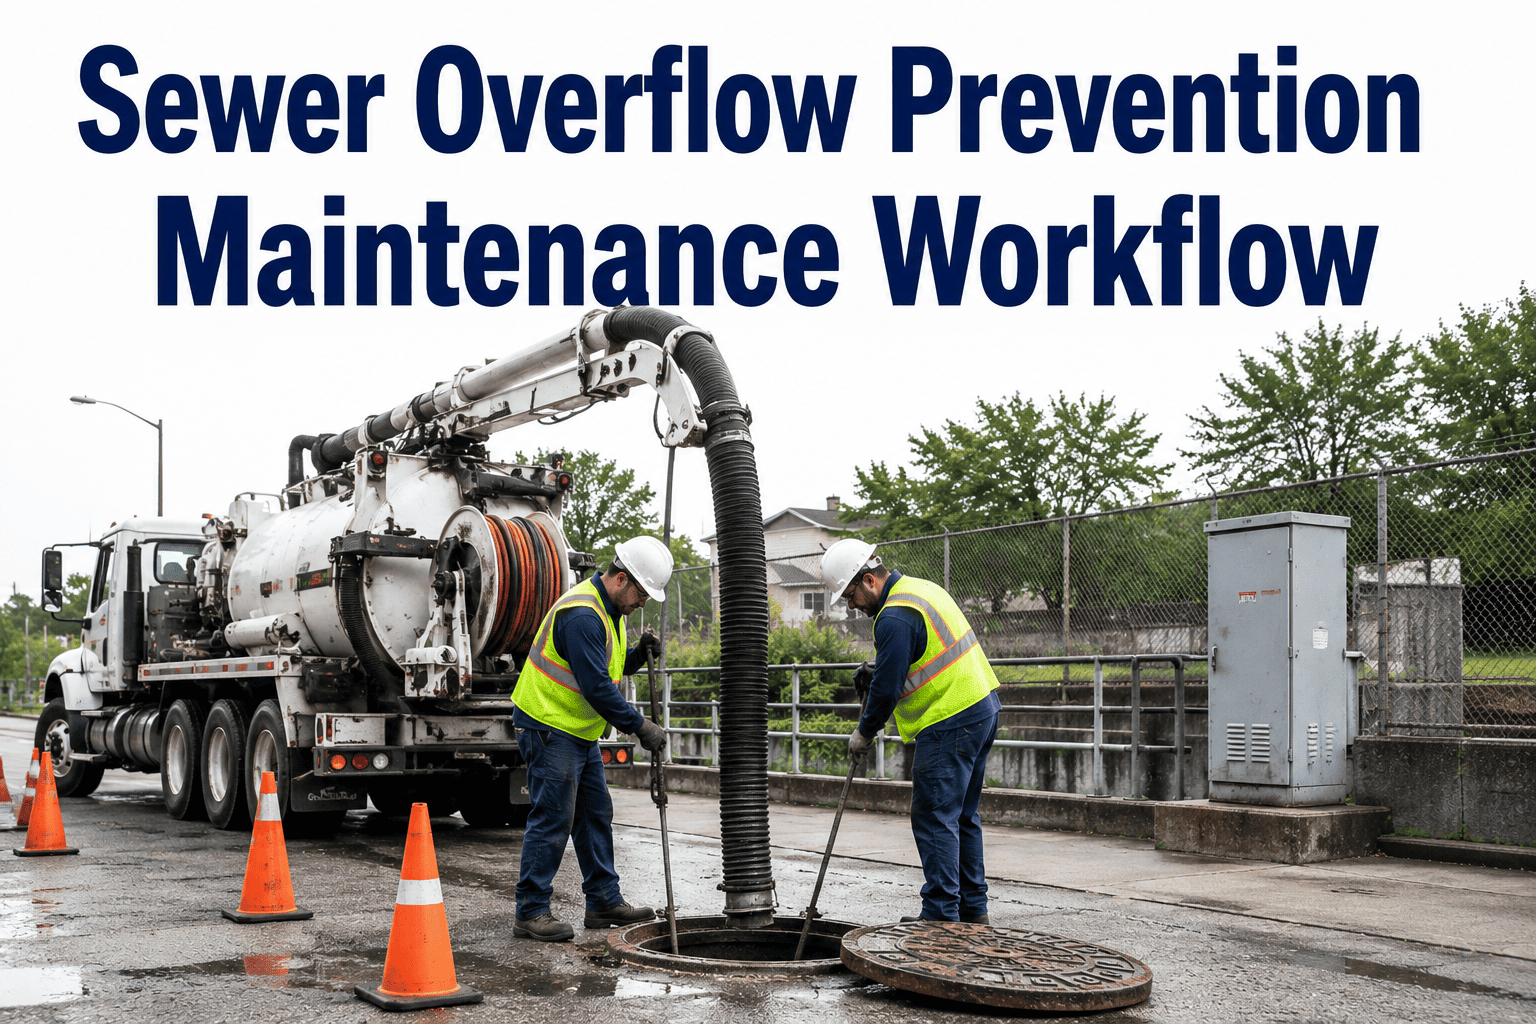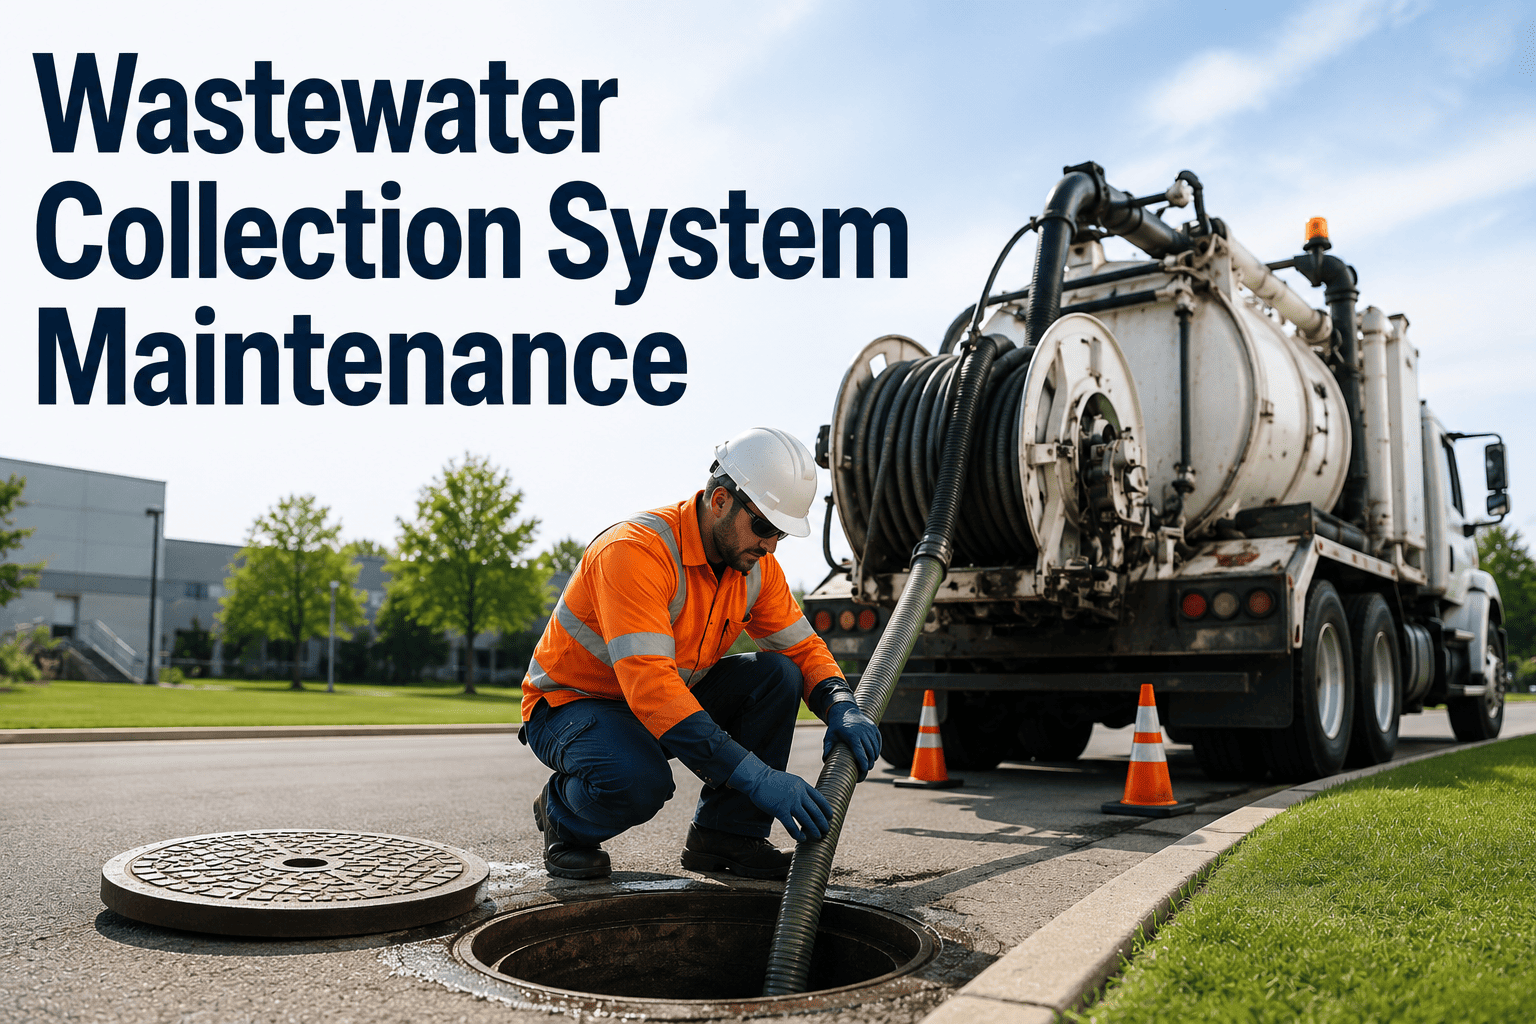
Sanitary sewer overflows are not just an operational nuisance — under the Clean Water Act, every SSO is a reportable event that can trigger EPA enforcement, consent decrees, and fines reaching tens of thousands of dollars per violation per day. For municipal public works teams, the line between a compliant wastewater collection system and one hemorrhaging budget is almost entirely a function of how disciplined the maintenance program is: how often lines are cleaned, how quickly CCTV inspections are scheduled, how reliably pump stations run, and how well a CMMS ties it all together. This guide lays out a practical, CMMS-driven collection system maintenance program covering cleaning, inspection, root control, and pump station reliability — and you can Start Free Trial to operationalize it inside oxmaint today.
Is one uncleaned sewer main quietly building your next EPA consent decree?
A single sanitary sewer overflow can cost a municipality $10,000–$100,000 per day in CWA penalties — before the street repair, the public outcry, and the mandated capacity program. The collection systems that avoid SSOs don't get lucky; they run a disciplined, CMMS-backed maintenance loop.
What an SSO actually costs a municipality
Roughly 60% of sanitary sewer overflows are caused by preventable blockages — fats/oils/grease, root intrusion, and debris in lines that were never cleaned on schedule. The financial exposure dwarfs the maintenance cost that would have prevented them.
A 220-mile collection system that shifts from "clean on complaint" to a risk-tiered CMOM cycle typically cuts SSO frequency 40–70% within 24 months — and recovers the program cost in avoided emergency callouts alone.
Building the collection system maintenance loop
A defensible CMOM program rests on five repeatable workstreams. Each one runs on a cycle, gets logged in the CMMS, and feeds the next — so inspection findings drive next quarter's cleaning priorities.
CCTV Inspection & Condition Assessment
Pipe-by-pipe PACP-coded inspection on a 5–10 year rotating cycle. Footage and defect codes (cracks, offset joints, infiltration, deposits) flow straight into the CMMS asset record, auto-generating rehab or cleaning work orders by severity.
Scheduled Sewer Cleaning & Flushing
Hydro-flush and vactor high-priority mains every 6–18 months based on grease history and SSO risk. Hot-spot lines with repeat blockages go on a 90-day cycle until two consecutive clean runs clear them back to routine.
Root Control & FOG Management
Foam herbicide treatment of root-heavy reaches on an annual or biennial cycle, plus a FOG ordinance backed by grease-trap inspection routes. Roots recur in the same 8% of mains — treat them proactively, not after the backup.
Lift Station & Pump Reliability
Weekly site checks, monthly SCADA-alarm tests, quarterly pump curve verification, and annual wet-well cleaning. Run-hours per pump are trended in the CMMS so a failing impeller is caught at a 15% efficiency drop — not at the 3 a.m. high-level alarm.
CMMS-Driven Work Order & Asset Registry
Every asset — manhole, main, air-release valve, pump — lives in one registry with inspection history, defect score, last-cleaned date, and next-due date. PMs auto-generate on cycle; emergency work orders close the loop back to the asset's risk tier.
Not every mile deserves the same frequency
Cleaning 100% of mains at the same interval wastes crew hours on lines that never block. A defensible program tiers mains by SSO history, FOG load, root recurrence, and downstream consequence — then commits the budget where risk is highest.
| Risk Tier | Profile | Cleaning Cycle | CCTV Cycle | Typical % of Miles |
|---|---|---|---|---|
| Hot-Spot | Repeat SSO or blockage in last 24 months; heavy FOG or root load | Every 3 months | Every 2 years | 5–10% |
| High | Commercial corridor, restaurant-dense, older vitrified clay | Every 6 months | Every 3 years | 15–20% |
| Moderate | Residential, mixed-age, intermittent root intrusion | Every 12 months | Every 5 years | 30–40% |
| Routine | Newer PVC residential, low complaint history | Every 18–24 months | Every 8–10 years | 30–45% |
A 180-mile system spending roughly $42K/year on reactive callouts reallocated 15% of cleaning hours to its Hot-Spot tier. Within 18 months SSO events dropped from 11/year to 3, emergency overtime fell 38%, and the program paid for itself in avoided response costs by month 9.
Measuring whether your program is actually working
Capacity, Management, Operations, and Maintenance isn't a binder — it's a measurable performance contract with your regulator. Three ratios tell you whether your CMOM program is healthy or circling toward a consent decree.
Benchmark: under 3.0 is healthy; over 8.0 signals a system headed for enforcement. Track monthly in the CMMS dashboard.
Target ≥ 90%. Below 80% means cleaning and inspection cycles are slipping — the leading indicator for next quarter's SSOs.
Best-in-class utilities run under 30% reactive. Above 50% reactive means crews are chasing failures instead of preventing them.
Lift stations: where one failed pump becomes a spill
A collection system's lift stations are its single points of failure. The maintenance cadence below is what keeps mean time between failures measured in years, not months — and keeps SCADA alarms from becoming 3 a.m. SSO responses.
Weekly — Site Visit
- ✓ Wet-well level & float switch function
- ✓ Pump alternation & run-hour balance
- ✓ Odor control system operation
- ✓ Visible leaks, seal weep, guard condition
Monthly — Functional Test
- ✓ SCADA alarm simulation (high-level, power fail)
- ✓ Standby generator / second-source exercise
- ✓ Check-valve and air-vac valve inspection
- ✓ Grease buildup on floats and rails
Quarterly — Performance
- ✓ Pump curve verification (flow vs. TDH)
- ✓ Meggar motor insulation resistance
- ✓ Bearing temperature & vibration trend
- ✓ Update run-hour forecast in CMMS
Annual — Deep Service
- ✓ Wet-well pump-down & pressure wash
- ✓ Impeller & wear-ring clearance check
- ✓ Seal replacement per OEM threshold
- ✓ Coating touch-up & corrosion log update
What a CMMS-backed program changes
The difference between a spreadsheet-driven sewer program and a CMMS-driven one isn't just convenience — it's the difference between defending your CMOM program to a regulator and scrambling to reconstruct it after an SSO.
- Cleaning cycles tracked on whiteboards and tribal memory
- CCTV footage trapped on hard drives, not linked to asset records
- Pump run-hours logged by hand — trends invisible until failure
- SSO reports reconstructed after the fact from crew notes
- No defensible audit trail for EPA or state regulators
- Auto-generated PMs fire on cycle, by asset, by risk tier
- Inspection defects and CCTV clips live on the asset record
- SCADA run-hours feed trend charts and predictive alerts
- Every SSO logs a complete, time-stamped response record
- One-click CMOM audit export — regulators in, evidence out
Stop managing SSOs after they happen.
Run your entire collection system program — cleaning, CCTV, root control, pump stations — in one CMMS built for municipal public works.
Collection system maintenance, answered
How often should municipal sewer lines be cleaned?
It depends on risk tier. Best practice is a tiered cycle: high-FOG and root-prone hot-spot mains every 3 months, commercial corridors every 6 months, residential lines every 12–24 months. A flat "clean everything annually" schedule wastes budget on low-risk mains while under-serving the 8–10% of lines that cause most blockages.
What triggers an EPA enforcement action for SSOs?
Any SSO that reaches waters of the United States is a CWA violation — and many states require reporting of all SSOs regardless of reach. Repeated or unreported overflows, lack of a CMOM program, and inadequate maintenance records are the most common triggers for consent decrees. A documented, CMMS-backed maintenance program is your primary defense. You can Start Free Trial to begin building that record today.
How does CCTV inspection feed back into the maintenance plan?
CCTV footage is PACP-coded for defect type and severity, then attached to the asset record in the CMMS. Defect scores automatically reprioritize cleaning frequency, flag lines for root treatment, and queue structural rehab candidates into the capital plan. Without that feedback loop, inspection data dies on a hard drive and the same defects cause the next SSO.
What's the right metric for pump station reliability?
Track mean time between failures (MTBF) per pump, run-hour balance across the lead/standby rotation, and trend pump-curve efficiency quarterly. A pump losing more than 15% flow against its design head is flagged for service before it fails. SCADA-integrated CMMS dashboards make this visible without manual data entry.
How long does it take to see results from a CMOM program?
Most utilities see SSO frequency drop 40–70% within 18–24 months of implementing a risk-tiered cleaning cycle, proactive root control, and CMMS-tracked PM compliance. Emergency callout costs typically fall faster — often within the first 6–9 months — as hot-spot mains get ahead of their blockage cycle. Book a demo to see the implementation path for your system.
Build a collection system regulators can't fault.
Documented PMs, defensible CMOM records, and a maintenance loop that actually prevents SSOs — all in one CMMS.
Free 14-day trial · No credit card