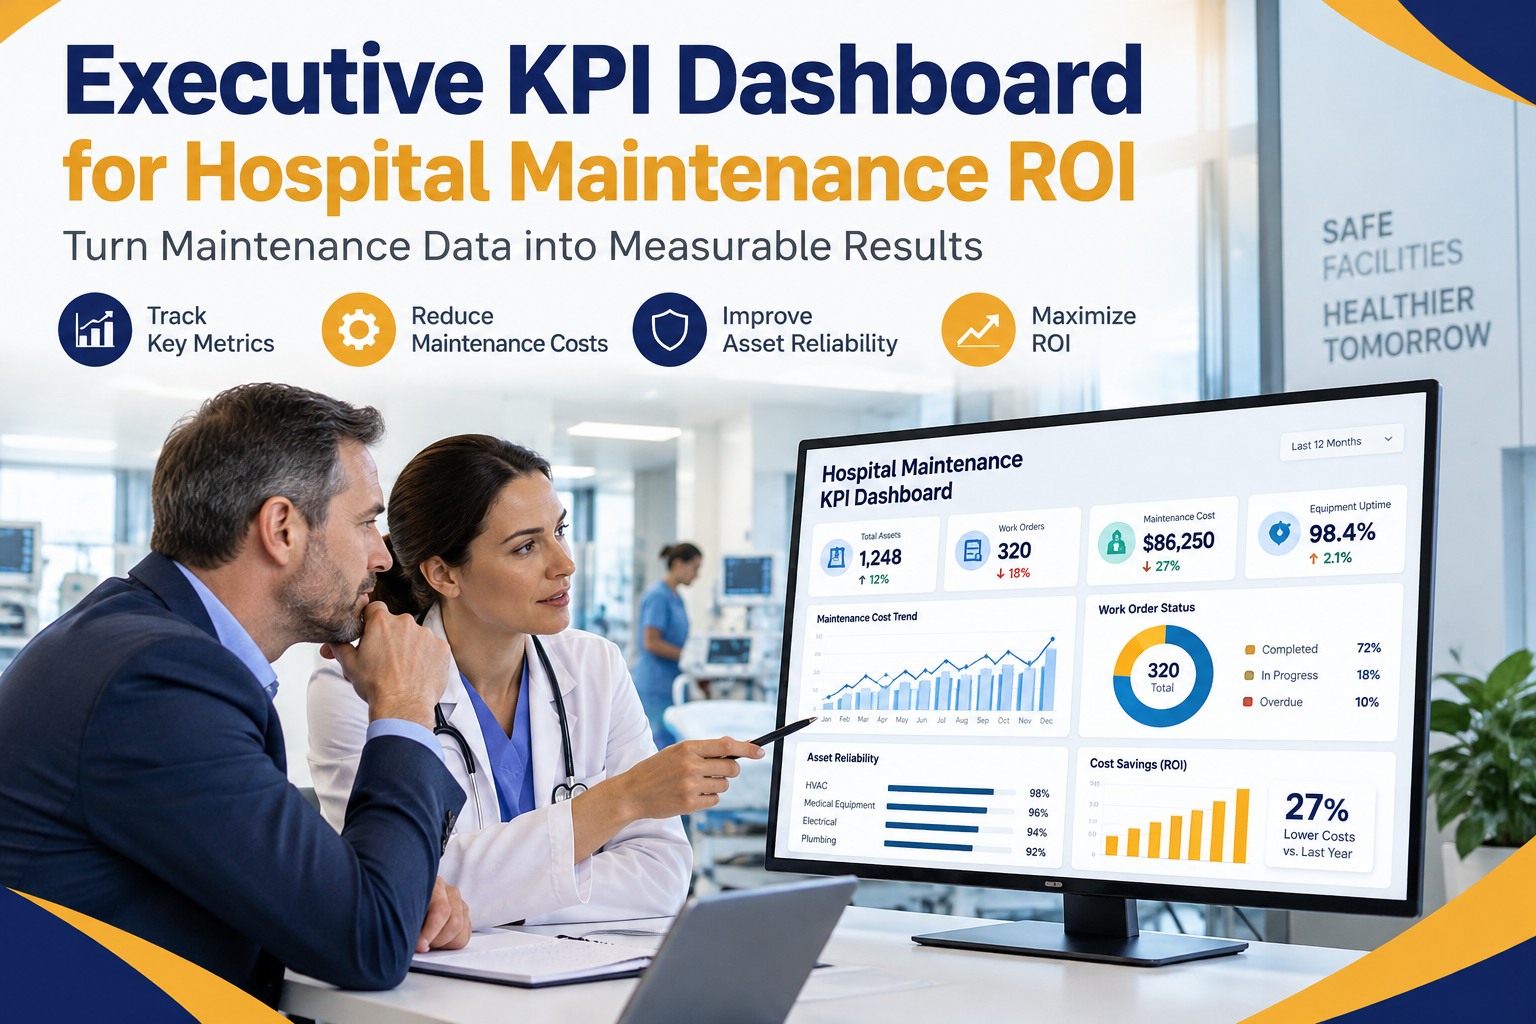
Executive KPI Dashboard for Hospital Maintenance ROI

By William Jerry on September 17, 2026

executive-kpi-dashboard-for-hospital-maintenance-roi

For hospital CFOs and COOs, maintenance has traditionally been a cost centre a line item to squeeze rather than an ROI lever to pull. That view is changing. Healthcare facilities running reactive maintenance overspend their maintenance budget by 18–34% versus benchmark peers, emergency repairs cost roughly 4.8× planned work, and every percentage point of critical-equipment uptime delivers $150,000–$300,000 in annual value. Predictive-maintenance programs typically return $3–$5 for every $1 invested, with measurable ROI in 6–12 months and 3–5× returns within 24. This guide is the executive-facing view of that shift: the 8 KPIs a hospital board actually cares about, the dollar-value calculation behind each one, and the 90-day business case for moving from reactive to predictive. Every KPI here is auto-calculated in OXMAINT AI, the healthcare CMMS that ties field execution to executive reporting.

Healthcare · Executive Dashboard · Predictive ROI · 2026

Executive KPI Dashboard for Hospital Maintenance ROI

Turn maintenance from cost centre to strategic lever — with a live 8-KPI executive dashboard tied to real dollars. OXMAINT AI, an AI-powered healthcare CMMS, connects field work orders to CFO-ready metrics so uptime, PM compliance & predictive-alert impact flow straight to the board deck.

18–34%
reactive-maintenance overspend vs benchmark
4.8×
emergency-repair cost multiplier vs planned
$3–$5
return per $1 invested in predictive maintenance
6–12 mo
typical predictive-maintenance ROI window

The Executive View Every CFO Wants

Every hospital executive has been in the same meeting: the maintenance director shows up with a stack of work-order reports, and the CFO asks "so what's the dollar impact?" The gap is the dashboard — a single view that translates PM compliance, uptime and MTTR into revenue protected, cost avoided and CapEx deferred. That's what the modern hospital maintenance executive dashboard delivers. Start free and turn your maintenance data into a CFO-ready dashboard.

CFO
"What's the ROI & cost avoidance?"
Cost-avoidance $ · CapEx deferred · Payback months
COO
"What's my uptime & risk exposure?"
Uptime % · P1 backlog · Compliance status
CMO
"Is patient care equipment ready?"
Critical-asset availability · MTTR · Overdue calibration
Board
"Are we operating at benchmark?"
Cost per bed · Reactive % · Program ROI

The 8 KPIs That Belong on the Executive Dashboard

A working executive dashboard displays leading indicators (predict future performance) side by side with lagging ones (confirm what happened). Improve the leading, and the lagging follow. Track lagging alone and you're steering with the rearview mirror. Here are the 8 that matter — with dollar-value framing for each. Book a demo to see all 8 on a live board deck.

KPI
Type
Target
Dollar impact per percentage-point
Critical Equipment Uptime
Lagging
≥ 90%
$150K–$300K / yr
PM Compliance Rate
Leading
≥ 95%
Direct MTBF driver
Emergency WO Rate
Lagging
< 10%
4.8× cost premium per event
MTTR (Critical Assets)
Lagging
Per asset baseline
Every hour = lost revenue
Maintenance Backlog Ratio
Leading
< 10%
2× emergency-failure rate above target
Cost / Bed / Year
Lagging
At or below benchmark
18–34% swing possible
Overdue Calibration Rate
Leading
0%
TJC / DNV / CMS audit exposure
Predictive Alert Yield
Leading
↑ Rising
Every catch = avoided failure

The Dollar Model — Where the Savings Actually Come From

Predictive maintenance ROI isn't a single line — it's five stackable savings streams, each measurable, each auditable, each traceable to a CMMS record. Here's how they compound into the $3–$5 return per dollar invested. Sign up free and start capturing each of these streams in OXMAINT AI.


Downtime Revenue Recovered
Hours of MRI, CT, OR & ICU equipment uptime recovered. Each hour of high-revenue asset uptime translates directly into billed exams & procedures.

Emergency-Repair Premium Avoided
Emergency & after-hours repairs run 4.8× the cost of planned work. Every failure caught predictively converts a premium spend into a scheduled one.

CapEx Deferred
Extended asset life from proactive intervention pushes replacement cycles out — one deferred imaging suite replacement can offset years of the CMMS spend.

Labour & Overtime Optimised
Planned work & efficient dispatch reduce overtime hours & contractor emergency callouts. Wrench time rises without headcount increases.

Compliance Cost Avoidance
TJC, DNV & CMS finding remediation runs into six figures. Auto-audit-ready records & zero overdue-calibration exposure remove that risk.

Field Data In. CFO Dashboard Out. One Platform.

The reason most hospital maintenance dashboards fail is disconnected data — WOs in one system, PMs in another, calibration logs in a spreadsheet. OXMAINT AI is the single platform where the field WO closure, the PM signature, the predictive alert, and the executive dashboard share one source of truth.

The Reactive → Predictive Payback Curve

The financial case for moving to predictive maintenance isn't linear. Month 1–3 delivers PM compliance & audit-readiness wins. Month 3–6 delivers MTTR improvement as work-order friction disappears. Month 6–12 delivers the big number: emergency-repair spend collapses & asset-life extends. Here's the payback shape hospitals typically see. Book a demo to see the payback modelled on your data.

Predictive Maintenance Payback — 24-Month Curve
5×3×1×0
Break-even 3–5× ROI
M0M3M6M9M12M15M18M24
Cumulative ROI multiple

The 90-Day Business Case Framework

Every board-approved predictive-maintenance program starts the same way — a 90-day pilot with a bounded asset scope, clear baseline metrics, and a documented savings model. Here's the framework OXMAINT AI runs healthcare teams through to build a defensible executive case. Sign up free and start Day 1 of the 90-day framework.

Days 1–30
Baseline & Scope
Pick pilot asset class: imaging, HVAC, or life-safety
Baseline PM %, uptime, emergency WO rate
Cost baseline: emergency repair, overtime, lost revenue
Days 31–60
Deploy & Instrument
Load PM templates & asset register into OXMAINT AI
Enable mobile WO & photo evidence capture
Activate predictive watchlist per asset subsystem
Days 61–90
Measure & Report
Publish executive dashboard vs baseline
Document each predictive catch with $ estimate
Board pack: ROI trajectory, payback month, scale plan

Compliance Is a Line on the ROI Sheet

TJC, DNV, HFAP & CMS surveys evaluate both physical equipment condition and documentation of maintenance activities. An unsigned WO or an overdue calibration is a finding — and finding remediation runs into six figures. Predictive maintenance closes the equipment gap; a modern CMMS closes the documentation gap. OXMAINT AI does both. Book a demo to see audit-ready records in OXMAINT AI.

TJC
Environment of Care & equipment management standards — PM completion & testing evidence
DNV
NIAHO standards — documented maintenance records for medical equipment & life safety
HFAP
Facility & equipment PM cycles evidenced by immutable timestamped records
CMS
Conditions of Participation — equipment maintenance & calibration documentation on demand

What OXMAINT AI Gives a Hospital Executive Team

OXMAINT AI is the CMMS layer between the field & the boardroom — capturing work at closure, calculating KPIs live, and translating them into the CFO/COO/CMO/Board views a modern healthcare executive needs. Sign up free and see the executive layer live within the first hour.

Role-Specific Dashboards
Pre-built CFO, COO, CMO & Board views — each pulling the same source data, translated into the language that role owns.
Auto-Calculated KPIs
Uptime, PM %, emergency WO rate, MTTR, backlog, cost/bed & predictive-alert yield — computed live from work-order events.
Dollar-Value Reporting
Every metric annotated with its dollar impact — uptime-point value, avoided-emergency premium, deferred CapEx.
Predictive Alert Engine
AI monitors imaging cryogen, HVAC pressure, life-safety anomalies — every catch logged as a documented ROI event.
Audit-Ready Compliance
TJC / DNV / HFAP / CMS-formatted records with one-click export — remediation cost avoidance built into the ROI model.
Benchmark Overlays
Cost-per-bed & PM-compliance benchmarks against industry standards so board reports show where you stand vs peers.
"

When I first sat down with the board on maintenance ROI, I had eight spreadsheets and a stack of vendor reports. Nine months in, we present one dashboard. PM compliance is up, our emergency WO rate is down, and — the number that changed the conversation — we can attribute a specific dollar figure to every predictive alert that turned into a scheduled repair. The board doesn't ask "how much did we spend on maintenance" anymore. They ask "how much did we save this quarter and how do we scale it to the next campus."

VP Facilities & Real Estate · Multi-Campus Health System

Frequently Asked Questions

What ROI does hospital predictive maintenance typically deliver?
Every $1 invested in predictive maintenance returns roughly $3–$5 in avoided emergency costs, extended asset life & compliance protection. Measurable ROI typically appears within 6–12 months, with cumulative returns of 3–5× within 24 months. Facilities with high-value imaging fleets or multi-site portfolios reach breakeven faster than average.
Which KPIs matter most for a hospital CFO?
The CFO-relevant set: PM compliance rate (≥95%), emergency WO rate (<10%), critical-equipment uptime, cost per licensed bed vs benchmark, and predictive-alert yield with dollar attribution. Every one of these translates directly into revenue protection, cost avoidance or CapEx deferral.
How much do hospitals overspend on reactive maintenance?
Most hospitals overspend their maintenance budget by 18–34% versus benchmark peers due to reactive work-order patterns. Emergency & after-hours repairs run 4.8× the cost of planned work — moving even a fraction of that volume into predictive schedules represents significant savings.
How does OXMAINT AI translate maintenance metrics into executive language?
Role-specific dashboards pull the same source data but present it in the language each role owns — cost avoidance & payback for CFO, uptime & compliance for COO, critical-asset readiness for CMO, benchmark position for the Board. One-click PDF exports & live embeds keep the reporting cycle current.
How fast can OXMAINT AI be deployed for executive reporting?
Most hospitals go live in 2–4 weeks — import the asset register, load PM templates, activate mobile WO capture, and the executive dashboard draws itself from live data. Multi-campus health systems typically complete rollout across all facilities in 6–8 weeks.

From Cost Centre to ROI Engine.

Turn hospital maintenance into a boardroom conversation — with an 8-KPI executive dashboard, dollar-value ROI modelling & audit-ready compliance, all in one platform. Start free — no credit card, unlimited users.
Share This Story, Choose Your Platform!