The price on the invoice is only the opening bid. Over its working life, a medical asset can cost far more to own, run and repair than it did to buy — and most hospital budgets are built from last year's spend, not from lifecycle cost. This guide shows where hospital maintenance money really goes, how to decide when to repair or replace, and how OXMAINT AI, the AI-powered CMMS, gives finance and facilities teams the asset data to forecast with confidence.
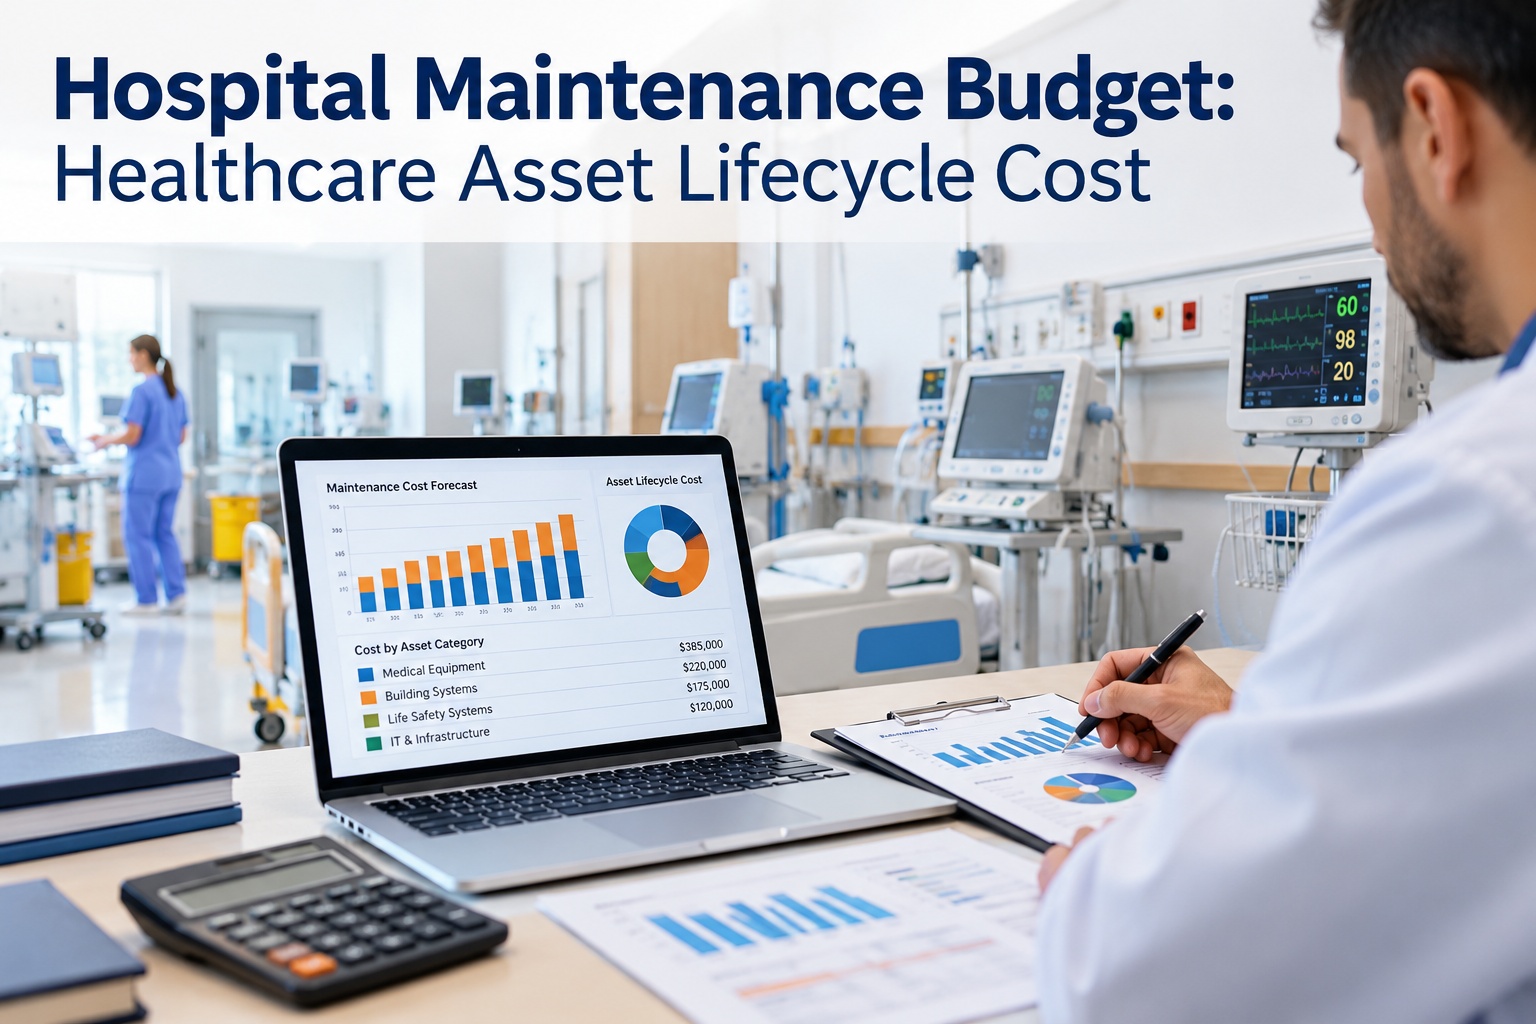
Hospital Maintenance Budget: Healthcare Asset Lifecycle Cost
When requests, inspections and repairs are logged in different places, your budget is built on partial history. OXMAINT AI, the AI-powered CMMS, connects the whole workflow in one platform, so parts, labour and condition are recorded against each asset as the work happens.
The result: asset-by-asset cost and condition visibility to plan maintenance and CAPEX from records, not estimates.
Figures are published industry benchmarks from 2026 hospital maintenance and equipment cost reports. Your facility's numbers will vary.
The Budget Line vs. the Real Cost
Most budgets show purchase price, a service contract and planned PM labour. The costs that break budgets sit below that line. Over a typical service life, total ownership cost has been reported at 150–300% above the purchase price. Book a demo to see lifecycle cost per asset in OXMAINT AI.
Why Waiting Costs More
Benchmark: Annual Maintenance Cost per Bed
Use these ranges as a sanity check for your own budget, then replace them with your real per-asset history. Start free and build that history in OXMAINT AI.
| Hospital type | OpEx / bed | CapEx / bed | Total / bed |
|---|---|---|---|
| Community (<200 beds) | $1,200–1,800 | $400–700 | $1,600–2,500 |
| Regional medical center | $1,500–2,200 | $600–900 | $2,100–3,100 |
| Academic medical center | $2,000–2,800 | $800–1,200 | $2,800–4,000 |
Budget Season Shouldn't Start With a Blank Spreadsheet.
When repair spend, PM history and condition live in separate files, every CAPEX request is an argument. A CMMS puts the evidence behind each asset in one place.
Repair or Replace? Use the Cost Signal
A widely used rule: when cumulative annual maintenance cost reaches 40–50% of an asset's replacement value, it's time to plan its replacement. Pair it with failure frequency and condition trends, and you'll also spot assets that can safely run 2–3 years longer than the standard schedule.
Annual maintenance cost as a share of replacement value.
Build a Lifecycle Budget in 5 Steps
Spreadsheets vs. a CMMS for Budgeting
| Budget task | Spreadsheets | OXMAINT AI CMMS |
|---|---|---|
| Cost per asset | Manual and often stale | Built automatically from work orders |
| PM scheduling | Reminders and memory | Automated and tracked to completion |
| Replacement planning | Age-based guesses | Condition and cost-based forecasts |
| Audit records | Scattered files | Searchable history for every asset |
Every year we argued over replacement requests using age and gut feel. Once repair cost and PM history sat against each asset, the conversation changed. We could show which equipment was draining money, which could wait, and what next year's spike would be.
Frequently Asked Questions
Budget With Evidence, Not Guesswork.
Track cost, condition and lifecycle for every asset in the OXMAINT AI maintenance management software, and walk into your next budget meeting with numbers you can defend.