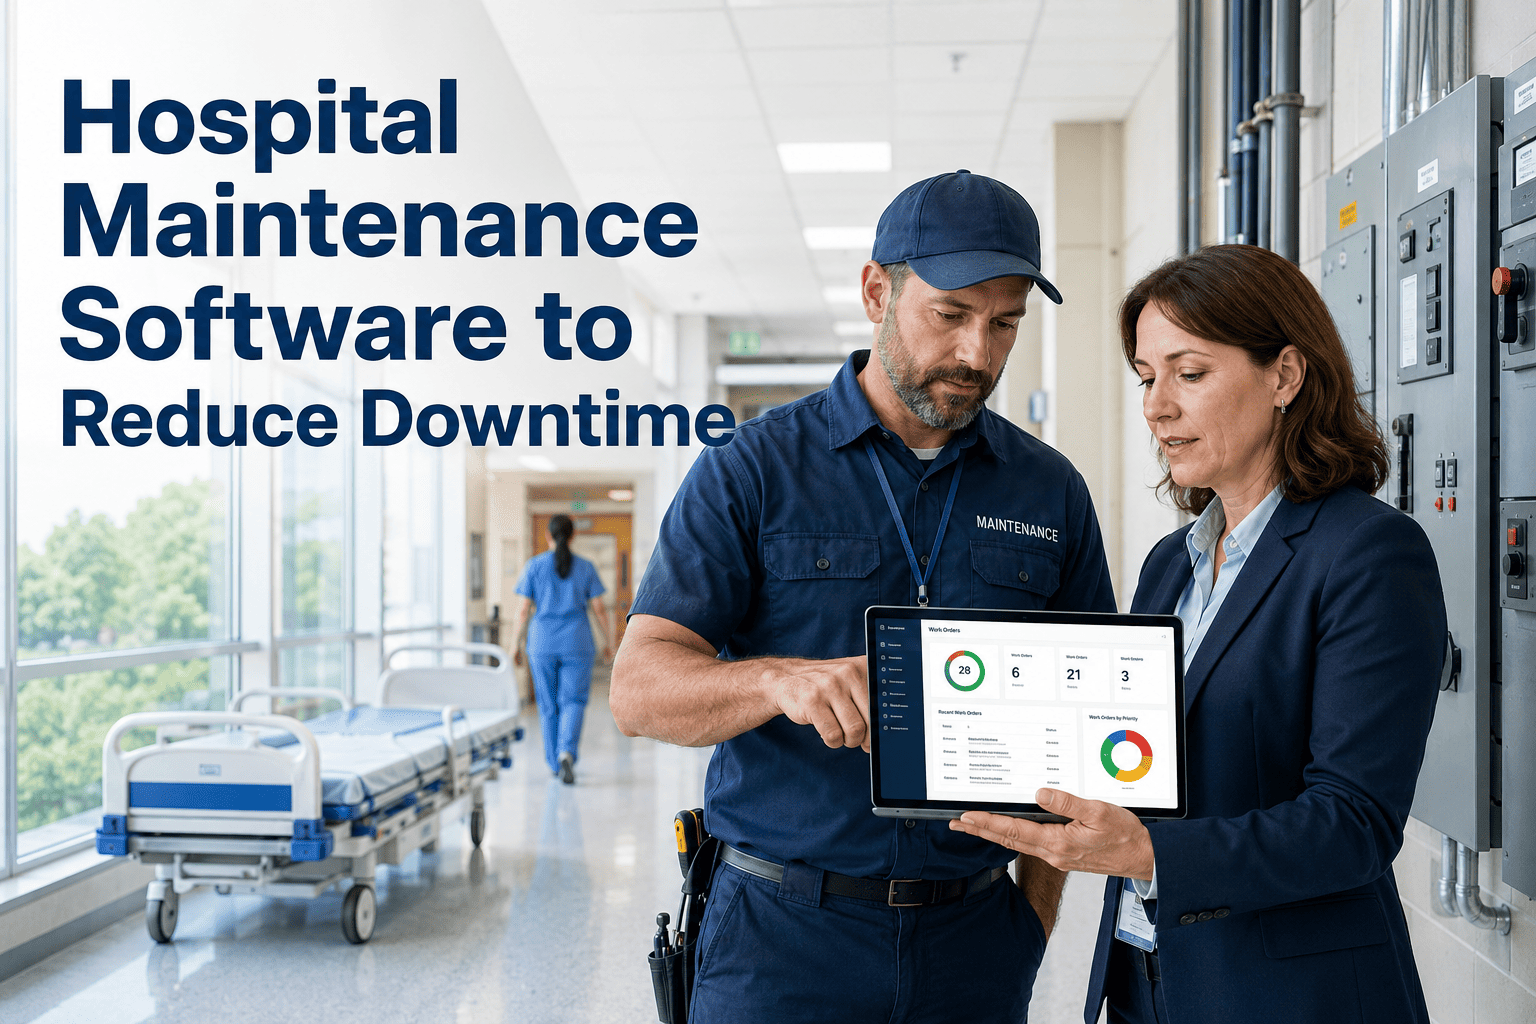
A deferred maintenance backlog averaging $11 per square foot across US hospital systems — combined with reactive work orders that cost 3 to 5 times more than planned preventive maintenance — produces an annual cost exposure that compounds with every missed PM cycle, every unplanned equipment failure, and every Joint Commission finding tied to documentation gaps. In 2024, 68 percent of healthcare facilities cited inadequate maintenance tracking as a primary driver of unplanned capital expenditure. The equipment existed. The technicians were available. The failure was in the system connecting work orders, asset history, and compliance documentation into a single auditable record. That gap is exactly what Oxmaint closes. Book a demo to see how Oxmaint digitizes hospital maintenance programs, equipment PM schedules, and compliance documentation across your full facility portfolio.
Hospital maintenance cost reduction requires disciplined control of four cost drivers: reactive-to-planned work order ratio, equipment PM compliance rates, vendor and parts procurement efficiency, and Joint Commission/CMS documentation readiness. Oxmaint digitizes the full maintenance program — connecting asset records, PM schedules, work order execution, and compliance documentation into one auditable system — enabling VP-level visibility into cost and compliance performance without manual reporting.
12 Strategies Across the Four Cost Drivers That Determine Hospital Maintenance Spend
Each cost driver has measurable benchmarks, a regulatory obligation, and a specific failure mode when managed without integrated digital tooling. Book a demo to see how Oxmaint structures all four into a unified cost reduction program.
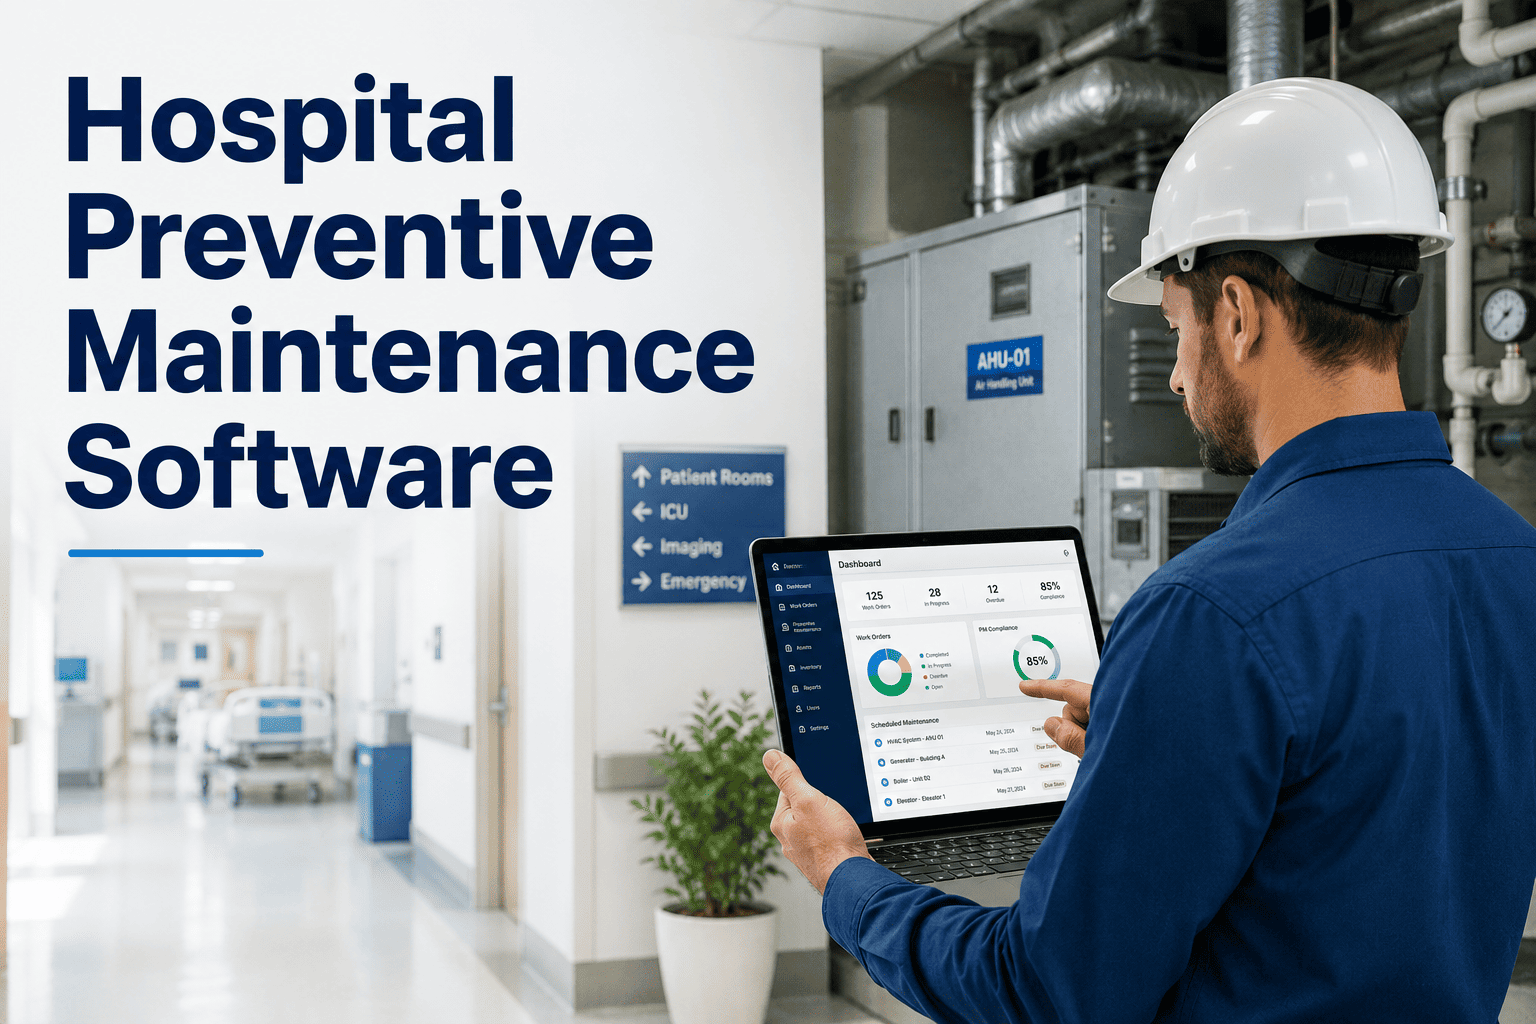
Strategy 1: Shift reactive-to-planned ratio toward 80% planned work using asset-based PM schedules. Strategy 2: Automate PM work order generation 30 days ahead of due date, eliminating missed cycles. Strategy 3: Track PM completion rates by department and technician to identify systemic gaps before they produce equipment failures or Joint Commission findings. Oxmaint generates PM schedules from asset inventory, assigns work orders automatically, and tracks completion against due dates in real time.
Strategy 4: Establish asset condition scores tied to repair history, enabling data-driven repair-versus-replace decisions that prevent premature capital expenditure. Strategy 5: Implement predictive maintenance triggers based on work order frequency and cost per asset — identifying equipment approaching end-of-life 12–18 months ahead of failure. Strategy 6: Build rolling 3-year capital replacement forecasts from Oxmaint asset data, replacing reactive board-level budget surprises with planned capital requests supported by documented asset performance history.
Strategy 7: Centralize vendor performance data — response times, invoice accuracy, and repeat-repair rates — to support contract renegotiation and vendor consolidation decisions with documented evidence. Strategy 8: Reduce parts carrying costs through consumption-based inventory management linked to active work orders, eliminating emergency procurement premiums. Strategy 9: Track labor hours per work order category to identify high-cost maintenance activities suitable for outsourcing or skills-based task reallocation. Oxmaint captures all three dimensions automatically from work order execution.
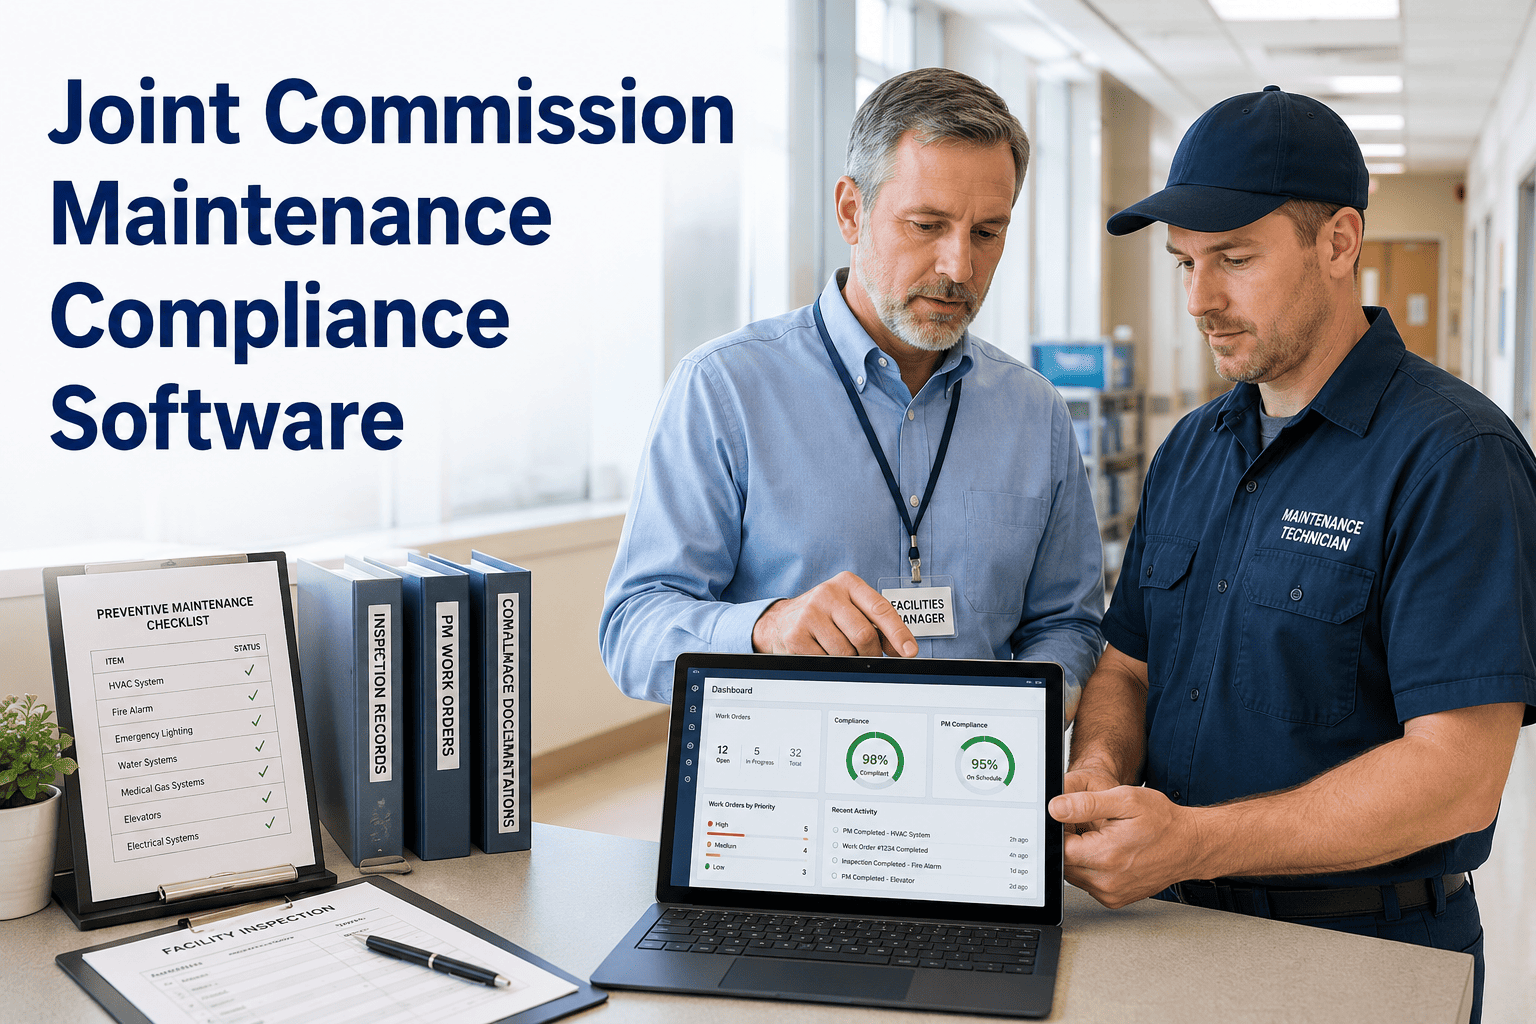
Strategy 10: Eliminate survey preparation costs — averaging $80K–$120K per Joint Commission cycle in manual record assembly — by maintaining audit-ready documentation in a digital system updated in real time. Strategy 11: Automate environment of care inspection schedules and capture findings with corrective action assignments and closure tracking, replacing paper rounds that produce incomplete records. Strategy 12: Build a single maintenance record per asset that satisfies Joint Commission EC chapter requirements, CMS documentation standards, and OSHA equipment safety obligations simultaneously — without separate record systems.
Every Work Order. Every PM Record. Every Compliance Document. Captured Automatically — Not Reconstructed.
Oxmaint generates PM work orders, captures technician sign-off on mobile, and archives completion records against each asset automatically — giving VP-level leadership real-time visibility into maintenance cost and compliance performance without manual reporting. Book a demo to see the PM compliance dashboard for your facility portfolio.
Oxmaint Implementation — From Cost Visibility to Sustained Cost Reduction
A structured deployment moves your hospital from fragmented maintenance records to a fully operational cost management system — without disrupting ongoing facility operations or existing vendor relationships.
Every maintainable asset registered in Oxmaint's asset hierarchy — clinical equipment, HVAC systems, electrical infrastructure, plumbing, elevators, and building systems — with acquisition cost, install date, warranty status, and PM frequency assigned. Current maintenance spend mapped against asset categories to establish the cost baseline against which reduction is measured. Reactive work order history imported to identify the highest-cost equipment for immediate PM prioritization.
PM schedules configured per asset from manufacturer specifications and ASHE guidelines — work orders generated automatically and pushed to technician mobile devices. Field teams complete work orders on mobile with parts used, labor time, and findings captured at point of work, not transcribed at shift end. QR-coded equipment tags deployed for instant work order access at the asset. Book a demo to see the mobile PM workflow for your equipment categories.
Oxmaint cost dashboard activated — maintenance spend by department, asset class, and vendor; reactive-to-planned ratio trending; PM compliance rates by building and system; labor and parts cost per work order category. CFO and VP of Facilities views configured with budget-versus-actual tracking. Automated weekly cost summary reports distributed to leadership without manual preparation. Vendor performance scorecards updated automatically from work order data.
All maintenance records, PM completion histories, environment of care inspection logs, and corrective action closures exportable in the format required for Joint Commission survey responses, CMS documentation reviews, and board-level capital planning presentations. Rolling 3-year capital replacement forecast generated automatically from asset age, repair cost trends, and condition scores in Oxmaint — updated quarterly without manual data assembly.
Regulatory Compliance Coverage by Healthcare Market
Hospital systems operating across multiple jurisdictions face different maintenance documentation obligations per market. Oxmaint's compliance templates are pre-configured for each primary regulatory framework.
| Region | Primary Compliance Frameworks | Key Maintenance Documentation Requirements | Oxmaint Coverage |
|---|---|---|---|
| USA | Joint Commission EC.02.05.01–EC.02.06.01, CMS Conditions of Participation 482.41, NFPA 99 Healthcare Facilities Code, OSHA 29 CFR 1910, ASHE Facility Guidelines | PM completion records per Joint Commission EC chapter, environment of care inspection logs, life safety equipment testing documentation, medical gas system maintenance records, fire protection inspection logs | Joint Commission-aligned PM templates, EOC inspection scheduling and corrective action tracking, life safety equipment registers, NFPA 99 medical gas documentation, automated survey package export |
| Canada | Accreditation Canada Qmentum, CSA Z8000 Canadian Health Care Facilities, Provincial Health Facility Regulations, NFPA 99 (adopted), ASHRAE 170 | Preventive maintenance records per CSA Z8000 asset management requirements, ventilation system maintenance documentation, medical device maintenance logs, contractor safety management records | CSA Z8000-aligned asset management templates, ventilation maintenance scheduling, medical device PM tracking, contractor induction and safety record management |
| UK | NHS Estates and Facilities Policy, HTM 00–06 series, COSHH Regulations 2002, PUWER 1998, LOLER 1998, CQC Regulation 12 (Safe Care and Treatment) | HTM-compliant PM records for medical gases, electrical systems, and ventilation; PUWER equipment inspection registers; LOLER lifting equipment certificates; CQC evidence of safe environment management | HTM series PM templates, PUWER and LOLER inspection scheduling with certificate tracking, CQC Regulation 12 compliance documentation, NHS ERIC data input preparation |
| Australia | NSQHS Standards Action 1.27, AS/NZS 3551 Medical Equipment Management, AS 1851 Fire Protection Maintenance, State Health Department facility requirements, Safe Work Australia WHS Regulations | AS/NZS 3551-compliant medical equipment maintenance records, AS 1851 fire protection inspection logs, essential services maintenance documentation, contractor and service provider safety records | AS/NZS 3551-aligned medical equipment PM templates, AS 1851 inspection scheduling, essential services registers, state-specific health department compliance documentation |
| Middle East / GCC | Saudi MOH Hospital Accreditation Standards, CBAHI Healthcare Accreditation, UAE HAAD/DOH Standards, Civil Defence maintenance inspection requirements, JCI International Standards | JCI-aligned PM documentation, Civil Defence inspection compliance records, medical equipment maintenance logs per CBAHI and HAAD requirements, contractor management documentation for large facility workforces | JCI and CBAHI-aligned PM templates, Civil Defence inspection scheduling, multilingual mobile forms for diverse site workforces, contractor safety and induction tracking |
Joint Commission, CMS, and International Healthcare Standards — One Digital Maintenance System
Whether your hospital network operates under Joint Commission in the US, HTM standards in the UK, or JCI internationally — Oxmaint pre-configures the correct PM templates, inspection schedules, and audit export formats for each jurisdiction in your portfolio. Book a demo to see multi-facility compliance configuration for your health system.
Oxmaint vs Competing CMMS Platforms — Hospital Maintenance Cost Management
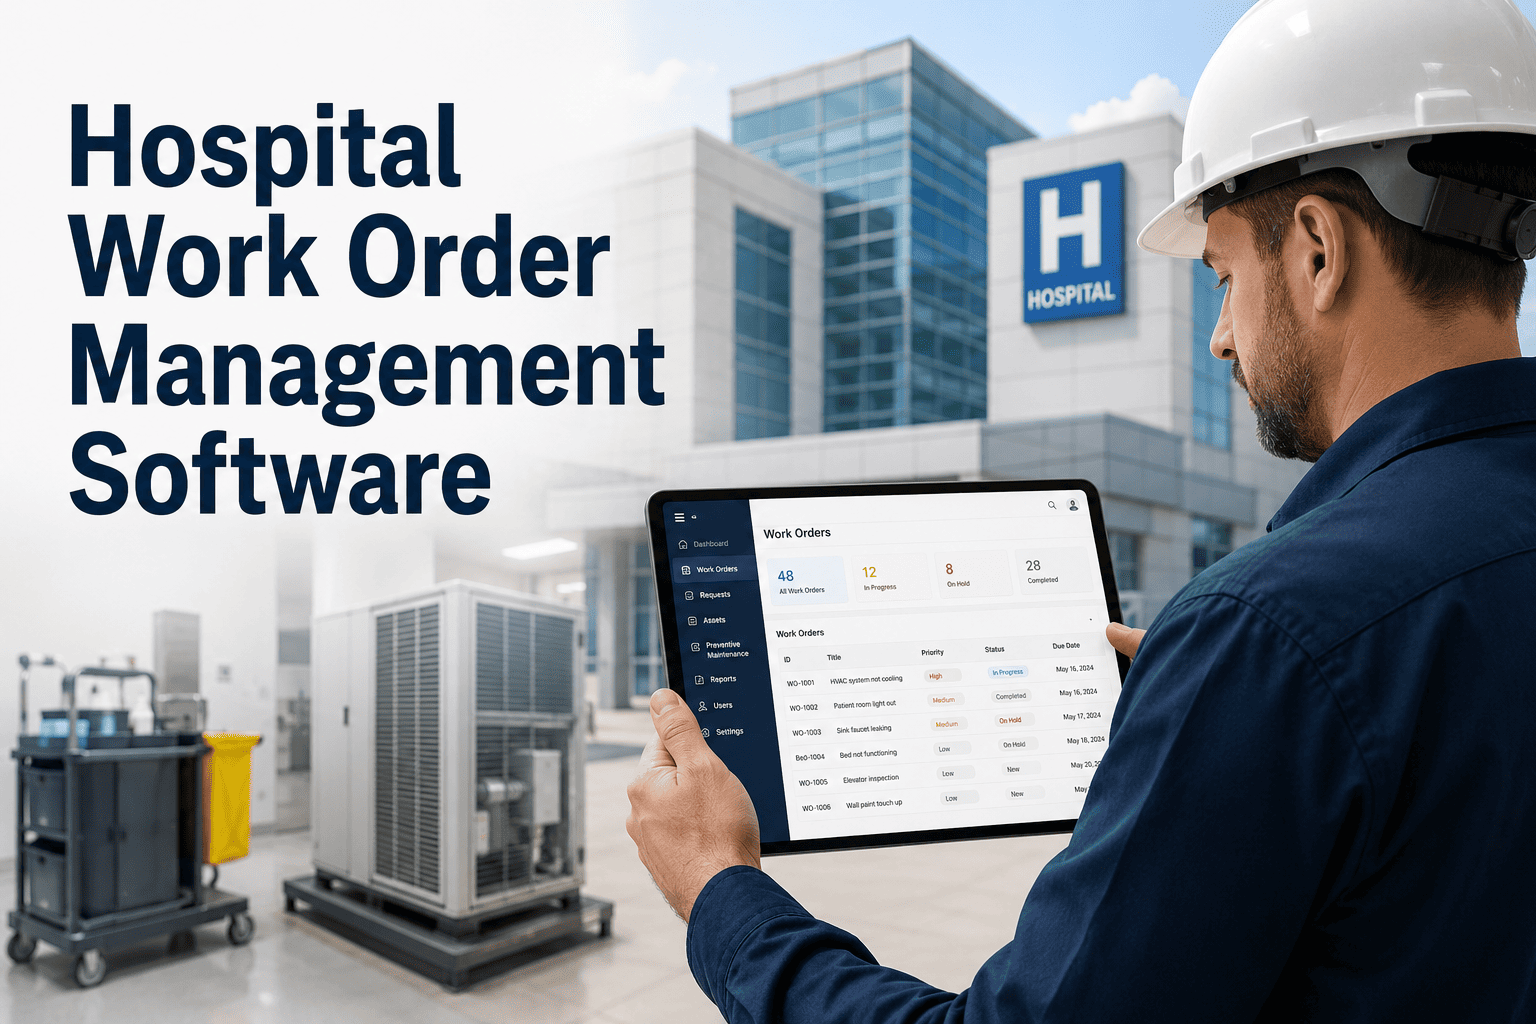
Most general-purpose CMMS platforms manage work orders — they do not manage PM compliance rates, capital cost forecasting, or Joint Commission documentation configured for healthcare facility operations.
| Capability | Oxmaint | MaintainX | UpKeep | Fiix | Limble | IBM Maximo | Hippo CMMS | Infor EAM |
|---|---|---|---|---|---|---|---|---|
| Healthcare-specific PM templates | Yes | Generic | No | No | No | Custom | No | Custom |
| Joint Commission survey-ready export | Yes | Partial | No | Partial | No | Yes | No | Partial |
| Reactive-to-planned ratio dashboard | Yes | Generic | Generic | Partial | Generic | Yes | Generic | Yes |
| Capital replacement forecasting | Yes | No | No | No | No | Yes | No | Yes |
| Vendor performance scorecards | Yes | Generic | No | Partial | No | Yes | No | Partial |
| EOC inspection rounds on mobile | Yes | Generic | Generic | Generic | Generic | Yes | Generic | Yes |
| Automated VP-level cost reporting | Yes | Partial | Partial | Partial | Partial | Yes | Partial | Yes |
| Deployment in weeks without consultant | Yes | Yes | Yes | Varies | Yes | No | Yes | No |
| Multi-facility portfolio rollup | Yes | Partial | Partial | Partial | Partial | Yes | No | Yes |
| Parts inventory cost management | Yes | Generic | Generic | Yes | Generic | Yes | Generic | Yes |
Hospital Maintenance KPI Benchmarks — Industry Baseline
Documented Outcomes — Hospital Systems Using Oxmaint
These outcomes are drawn from hospital facility deployments where Oxmaint's digital maintenance program replaced paper-based PM tracking and disconnected work order management within the first year of operation.
From 58% to 94% PM Compliance — and $2.1M in Avoided Capital Spend — Within Year One
Hospital systems that move from fragmented maintenance records to Oxmaint's digital program close the cost gap before the next budget cycle — not after. Book a demo to see your current PM compliance gap and projected cost reduction identified in the first deployment session.
Oxmaint Platform Capabilities for Hospital Maintenance Cost Management
Asset-based PM schedules generate work orders automatically per manufacturer spec and ASHE guidelines — pushed to technician mobile 30 days ahead of due date with parts, procedures, and compliance documentation pre-loaded.
Maintenance spend by department, asset class, and vendor — reactive-to-planned ratio trending, PM compliance rates, labor and parts cost per work order category — updated in real time from field execution data without manual reporting.
Rolling 3-year capital forecast generated from asset age, repair cost trends, and condition scores — updated automatically each quarter, replacing reactive board-level budget surprises with planned capital requests backed by documented asset performance data.
Vendor response times, invoice accuracy, recall compliance, and repeat-repair rates tracked automatically from work order data — producing documented performance scorecards that support contract renegotiation and consolidation decisions with evidence.
All maintenance records, EOC inspection logs, life safety equipment tests, and corrective action closures maintained in the format Joint Commission EC chapter requires — exportable in under 2 hours for any survey or CMS documentation review.
System-level and facility-level views configured in the same platform — giving health system VP leadership consolidated cost and compliance performance across the entire portfolio without separate reporting tools or manual data consolidation.
Cost and Compliance Impact — Key Metrics Compared
| Metric | Paper / Disconnected Systems | With Oxmaint |
|---|---|---|
| PM completion rate | 58% industry average — 42% of scheduled work missed or undocumented | 94% completion rate within 90 days — automated scheduling eliminates missed cycles |
| Reactive work order share | 54% reactive — costing 3 to 5 times planned maintenance per event | 17% reactive within 6 months — PM compliance shift reduces emergency response volume |
| Joint Commission survey preparation | 3-week manual document assembly — $80K–$120K internal cost per cycle | 90-minute automated export — documentation maintained continuously, not assembled at survey time |
| Capital replacement planning | Reactive board-level requests without documented asset performance evidence | Rolling 3-year forecast from asset condition data — eliminates unplanned capital requests |
| Vendor cost management | Contracts renewed without performance data — no leverage in renegotiation | Documented performance scorecards support 12–19% contract cost reduction at first renewal |
| EOC corrective action closure | Average 51 days to close — no escalation visibility until survey finding | Average 14 days to close — automated escalation at day 20 prevents survey exposure |
| VP cost reporting | Monthly manual report requiring 2–3 days of data consolidation per cycle | Automated weekly report distributed from live Oxmaint data — zero manual preparation |
Frequently Asked Questions
Reduce Hospital Maintenance Costs — Starting With PM Compliance and Capital Visibility
PM schedule automation, VP-level cost analytics, capital replacement forecasting, vendor performance management, and Joint Commission documentation — all operational in Oxmaint within 4 to 6 weeks, no IT project required. Book a demo with your VP of Facilities and see the full cost reduction roadmap configured for your facility portfolio and current maintenance spend.