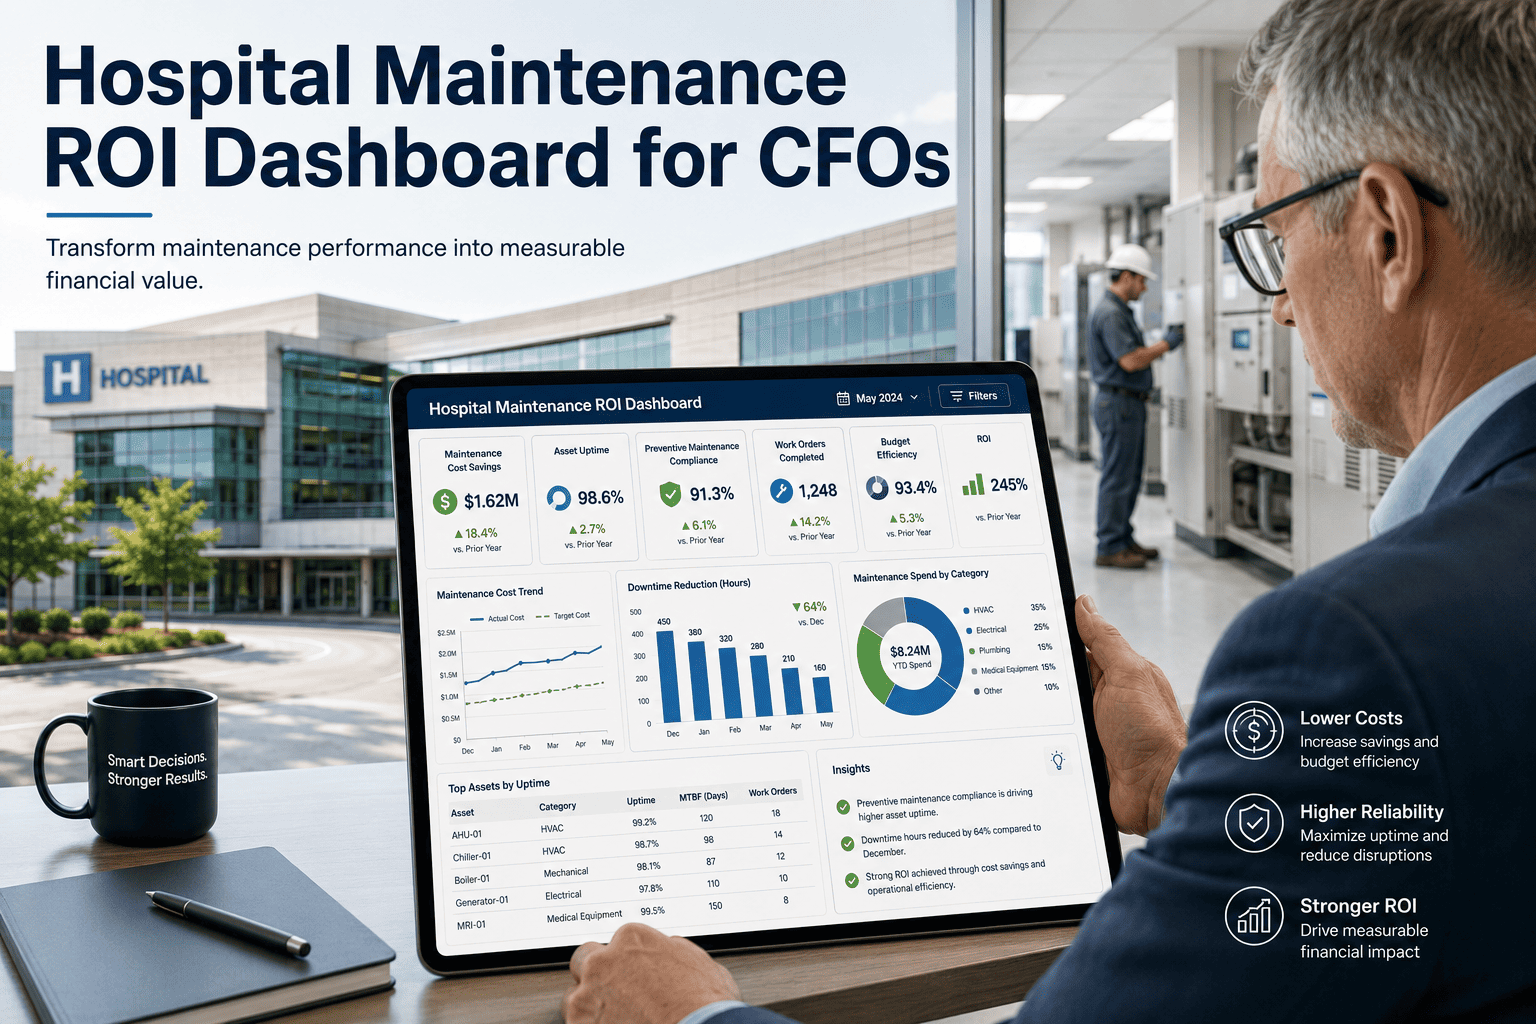
Hospital CFOs face a structural challenge unique to healthcare finance: maintenance budgets are treated as operational cost centers, yet the consequences of deferred maintenance — surgical suite downtime, regulatory citations, equipment failure during patient procedures, and accelerated asset replacement — register as multi-million dollar events across clinical, legal, and capital budgets. OxMaint provides hospital finance leaders with a maintenance ROI dashboard that converts the operational data your facilities team produces every day — work order volumes, PM compliance rates, downtime incidents, asset replacement costs — into the executive-level financial KPIs that support budget defense, capital allocation decisions, and value-based care cost management reporting.
DOWNTIME COST
$11,000
avg. cost per hour of OR equipment downtime (ASHE, 2023)
PM COMPLIANCE LIFT
31%
avg. reduction in emergency repair spend after structured PM program
ASSET LIFE EXTENSION
2.4 yrs
avg. additional useful life from documented preventive maintenance programs
SURVEY RISK REDUCTION
58%
fewer EC findings in hospitals with digital maintenance documentation systems
HOSPITAL FINANCE INTELLIGENCE
Give Your CFO the Maintenance ROI Numbers That Actually Matter
OxMaint converts facility data into executive KPI dashboards — downtime cost savings, PM ROI, labor efficiency, and asset lifecycle value.
What OxMaint Puts in the CFO Dashboard
Downtime Cost Avoided
Calculates the financial value of equipment failures prevented by PM completion — expressed in hours of clinical service preserved and revenue-equivalent downtime avoided per department.
Emergency vs. Planned Repair Ratio
Shows the shift from reactive to planned maintenance spend over time — demonstrating that PM investment reduces the higher-cost emergency repair burden that erodes maintenance budgets.
PM Compliance Rate by Department
Tracks scheduled vs. completed maintenance tasks across surgical, imaging, pharmacy, and facilities zones — giving compliance officers and risk managers the evidence trail for regulatory defense.
Asset Replacement Forecast
Converts maintenance history and condition data into a 3 to 5 year capital replacement forecast — allowing finance to budget proactively for high-cost equipment before the emergency replacement event.
Labor Efficiency Index
Measures technician productivity — planned vs. reactive work ratio, work order close time, and callback rate — supporting staffing justification and outsourcing decision analysis.
Regulatory Risk Score
Aggregates overdue inspections, open corrective actions, and compliance gaps into a risk index — giving risk management and the CFO a single number representing regulatory exposure at any moment.
The Business Case: Reactive vs. OxMaint-Managed Maintenance
Without OxMaint
Emergency repairs cost 3–5x planned maintenance labor
Equipment failures discovered during clinical use
Capital replacement driven by failure, not planning
Survey prep requires weeks of manual record assembly
CFO cannot quantify maintenance program ROI
With OxMaint
PM cost tracked and compared to avoided failure cost
Condition trends detected before clinical impact
3–5 year capital forecast from asset health data
Compliance evidence auto-generated, always current
Executive dashboard shows ROI in real time
EXPERT REVIEW
Rachel Adler, MBA, CHFM
Certified Healthcare Facility Manager & Former Hospital CFO Advisor — 20 Years Health System Finance
Hospital CFOs fund maintenance programs by intuition because nobody shows them the numbers. When I've helped health systems build maintenance ROI models, the response from finance leaders is almost always the same: they had no idea that deferred PM was showing up as emergency capital spend, extended equipment downtime charges, and survey remediation costs. A CMMS that connects those dots — here is what we spent on planned maintenance, here is the failure cost we avoided, here is the asset life we extended — turns maintenance from a cost center into a demonstrable value center. That conversation changes budget outcomes.
Build Your Hospital Maintenance ROI Report in 30 Minutes
Book a demo and see how OxMaint converts your facility data into CFO-ready financial KPIs.
Frequently Asked Questions
What financial data does OxMaint need to generate a hospital maintenance ROI dashboard?
OxMaint builds ROI metrics from operational data your facilities team already generates: work order volume and labor hours, PM completion rates, emergency repair frequency and cost codes, asset age and replacement value, and downtime incidents. No custom finance integration is required to start generating ROI reports — the OxMaint dashboard assembles this data automatically as your team uses the platform. For deeper financial integration, OxMaint connects to ERP and cost accounting systems via API.
How does OxMaint calculate avoided downtime cost for hospital equipment?
OxMaint uses a configurable cost model where you input the revenue-per-hour or cost-per-hour value for key equipment categories — surgical suites, imaging equipment, sterile processing. When a PM task prevents a detected failure, the system calculates the potential downtime value avoided based on equipment type and historical failure duration data. These estimates are clearly labeled as avoidance calculations, not actuals, so CFOs and finance teams can apply their own confidence factors when presenting to boards. Book a demo to configure the model for your facility.
Can OxMaint ROI reports be formatted for board-level presentation or bond rating reviews?
Yes. OxMaint's reporting module exports executive summaries in PDF and Excel formats with custom branding and configurable metric groupings — suitable for board facilities committee presentations, bond covenant compliance reporting, and health system leadership reviews. CFOs at multi-campus systems can roll up maintenance performance and financial impact data across all facilities in a single consolidated report that shows enterprise-wide program ROI.
How quickly can a hospital get from OxMaint implementation to ROI dashboard visibility?
Most hospital facilities teams have meaningful ROI data within 60 to 90 days of OxMaint deployment — once PM schedules are configured, work orders are flowing, and the baseline for emergency vs. planned repair ratio is established. The asset replacement forecast and regulatory risk score begin accumulating accuracy as maintenance history builds over 6 to 12 months. Implementation typically takes 2 to 4 weeks depending on asset inventory size and existing data sources available for migration.