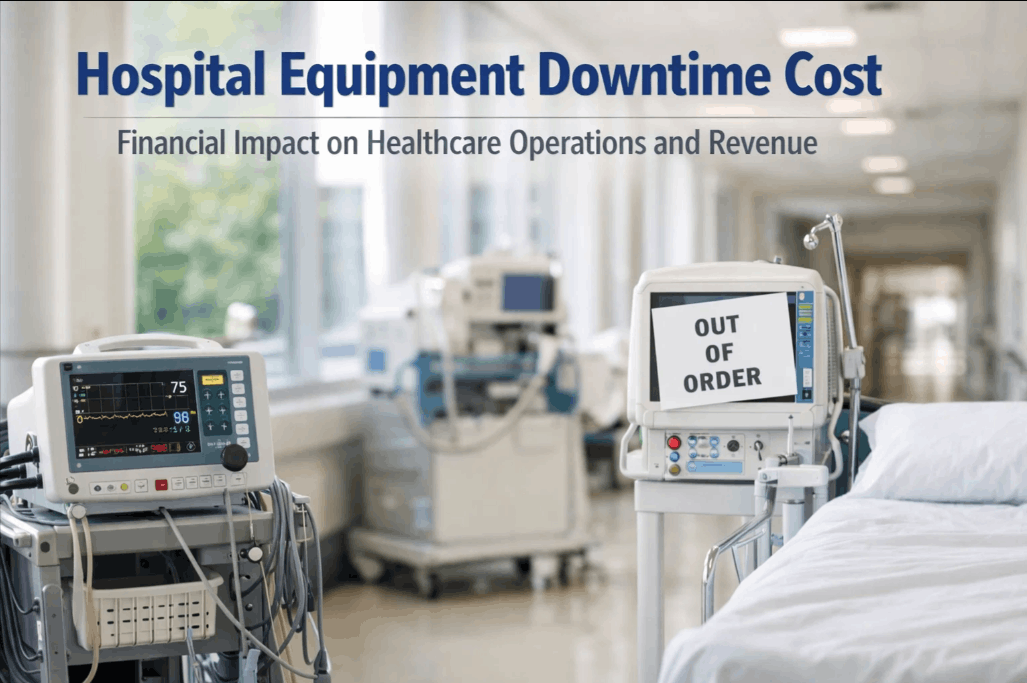
Hospital equipment downtime is one of the most financially damaging and operationally disruptive challenges facing healthcare systems today. From imaging suites and surgical robots to ventilators and infusion pumps, every hour a critical medical device sits offline translates directly into lost revenue, delayed patient care, and mounting operational costs. For healthcare CFOs, facility directors, and clinical engineering leaders, understanding the true financial impact of equipment downtime — and the strategies that mitigate it — is no longer optional. It is a core competency of sustainable hospital operations.
The True Financial Cost of Hospital Equipment Downtime
Beyond the Repair Bill: Total Cost of Ownership Under Failure
Most hospital administrators track the direct cost of equipment repair — parts, labor, and vendor service contracts. But the complete financial picture of hospital equipment downtime is far more complex. When a high-utilization asset goes offline unexpectedly, the revenue disruption dwarfs the repair cost within hours. An MRI scanner generating $2,000 to $3,000 per scan session can lose a hospital $30,000 to $80,000 in daily revenue during an unplanned outage. Multiply that across multiple downtime events per year and across a portfolio of imaging, surgical, and critical care equipment, and the annual revenue impact runs into the millions at even a mid-sized community hospital.
Indirect costs compound the direct losses. Emergency service escalations carry premium rates. Clinical staff reassigned from patient-facing work to managing equipment disruption generate opportunity costs that never appear on a repair invoice. Surgical case delays trigger domino effects across the OR schedule, inflating overtime and frustrating surgeons whose productivity is tightly linked to institutional revenue. Patient diversions to competing facilities carry long-term market share consequences that financial models routinely underestimate. A comprehensive healthcare equipment downtime analysis must account for every layer of this cost cascade — Sign Up Free to start monitoring the assets most exposed to these losses.
High-Impact Equipment Categories and Their Downtime Cost Profiles
Where Operational Loss Is Most Concentrated
Not all hospital equipment carries equal downtime risk. The financial impact of a failed infusion pump differs dramatically from an offline CT scanner or a malfunctioning surgical robot. Clinical engineering and finance teams must build equipment-specific downtime cost models that reflect actual utilization rates, reimbursement profiles, and patient flow dependencies. The following categories consistently generate the highest operational losses when availability falters.
Healthcare Equipment Downtime Analysis: A Financial Framework
Building the Full-Cost Model for Executive Decision-Making
A rigorous healthcare equipment downtime analysis requires integrating data across clinical operations, finance, and facilities management — three departments that rarely share a common reporting framework. The starting point is establishing an accurate utilization baseline for each asset: how many procedures, scans, or service hours does the equipment generate per day under normal operational conditions, and what is the average revenue per unit of utilization? This baseline enables straightforward revenue-per-downtime-hour calculations that give executive teams a visceral sense of the financial stakes.
Beyond revenue, the full-cost model must incorporate emergency service premiums, technician overtime, temporary equipment rental or outsourcing costs, patient transport or referral losses, clinical staff redeployment costs, and any regulatory or compliance costs triggered by the failure event. When these inputs are aggregated across a full fiscal year and benchmarked against the cost of a structured predictive maintenance program, the ROI case for proactive asset management becomes overwhelming. calculations consistently demonstrate that every dollar invested in condition-based monitoring returns three to seven dollars in avoided downtime costs within 24 months — Book a Demo to see the ROI case built for your facility.
MRI Downtime Cost: A Case Study in High-Value Asset Risk
Why Imaging Systems Demand Dedicated Uptime Strategy
MRI systems exemplify the compounding financial risk of high-value asset downtime in healthcare settings. A 1.5T or 3T MRI scanner operating at typical academic medical center utilization rates generates 20 to 40 billable scans per day, with reimbursement rates ranging from $400 to $3,500 per scan depending on payer mix and scan type. At even modest utilization, a single MRI system can generate $2 million to $8 million in annual revenue. An MRI downtime cost analysis that accounts for just five to ten unplanned downtime days per year — a conservative estimate at many facilities — reveals revenue exposure of $100,000 to $800,000 per system annually before emergency service costs are included.
MRI-specific failure modes add complexity to the risk picture. Helium quench events — in which the superconducting magnet loses its cryogenic charge — can require 24 to 72 hours of recovery time and $50,000 to $150,000 in helium recharging and vendor service costs. Gradient amplifier failures, RF system degradation, and cooling system anomalies each carry their own lead time, service cost, and revenue displacement profile. Predictive monitoring of thermal signatures, system error logs, and cooling performance parameters enables engineering teams to identify developing issues before they escalate to full system failure — protecting both the capital asset and the revenue stream it anchors.
Hospital Operational Loss: The Systemic Impact Beyond Individual Assets
How Equipment Failures Cascade Across the Care Continuum
Healthcare executives often assess equipment downtime as an isolated event — a single broken machine with a single repair cost. In operational reality, equipment failures are systemic disruptions. When a CT scanner goes offline in the emergency department, throughput across the entire ED slows as alternative diagnostic pathways are activated. Boarding rates climb as patients wait longer for imaging before admission decisions can be made. Ambulance diversions may be triggered, reducing ED volume and the downstream admissions that follow. Within 90 minutes of a single high-utilization equipment failure, the ripple effects can reach across multiple clinical departments simultaneously.
Hospital operational loss calculations that account for this cascade effect routinely reveal total event costs three to five times higher than the direct repair and immediate revenue displacement figures. For health system CFOs building the business case for capital investment in medical device uptime monitoring infrastructure, this systemic multiplier is the most compelling argument in the portfolio. A single avoided failure event on a high-utilization imaging or surgical system can generate positive ROI on an entire predictive maintenance platform investment.
Predictive Maintenance for Healthcare Equipment: The Operational Imperative
Shifting from Scheduled Intervals to Condition-Based Intelligence
Traditional time-based preventive maintenance schedules were designed for a simpler era of medical equipment. Today's hospital asset portfolios include networked diagnostic systems, AI-assisted surgical platforms, and software-dependent life-critical devices whose failure modes are not captured by calendar-driven inspection protocols. Predictive maintenance for healthcare equipment replaces the blunt instrument of scheduled servicing with continuous, data-driven monitoring that intervenes precisely when equipment condition — not the calendar — dictates.
Modern predictive maintenance platforms ingest data from IoT sensors, equipment error logs, environmental monitoring systems, and service history databases simultaneously. Machine learning models trained on hospital-specific operational data establish dynamic baselines that account for equipment age, utilization patterns, environmental conditions, and seasonal load variation. When sensor readings begin to deviate from established normal ranges in patterns that match known failure precursors, the system generates prioritized alerts with predicted failure timelines, recommended interventions, and required parts lists — giving clinical engineering teams the lead time to act before downtime occurs. Hospital asset performance management platforms like OxMaint are built specifically for this level of operational intelligence across complex healthcare environments — Sign Up Free to see it in action.
Building the Executive Case for Healthcare Maintenance ROI
Aligning the Investment with Health System Financial Priorities
Securing capital approval for predictive maintenance technology in a healthcare system requires translating operational outcomes into the financial language of executive leadership. The ROI conversation should anchor on three quantifiable value streams: direct cost avoidance from eliminated emergency repairs, revenue protection from reduced equipment downtime, and regulatory cost avoidance from automated compliance documentation and reduced incident rates. Each of these streams should be modeled using the hospital's own asset utilization data, historical maintenance expenditure records, and documented downtime event costs.
A 500-bed hospital with 15 high-value imaging and surgical systems spending $2 million annually on emergency maintenance and absorbing $3 million in annual downtime-related revenue displacement has a clear and defensible ROI case for a predictive maintenance platform investment in the $200,000 to $400,000 annual range. The financial argument is not close — it is categorical. For health systems that have not yet conducted a formal healthcare equipment downtime analysis, the first step is often the most illuminating: simply aggregating historical emergency repair costs and documented downtime events reveals a financial burden that was previously invisible because it was distributed across dozens of departmental cost centers with no consolidated view.
Frequently Asked Questions
What is the average financial impact of hospital equipment downtime per event?
The financial impact varies significantly by equipment type and utilization rate. For high-volume imaging systems like MRI and CT, a single unplanned downtime event lasting six to eight hours can displace $15,000 to $80,000 in procedure revenue, plus emergency service costs ranging from $5,000 to $30,000. Surgical robot failures with full-day OR cancellations can exceed $200,000 in combined direct and indirect costs. When aggregated across all equipment categories, total annual downtime costs at a mid-sized hospital commonly range from $3 million to $10 million.
How does predictive maintenance differ from standard preventive maintenance for medical equipment?
Preventive maintenance follows a fixed service calendar — equipment is inspected and serviced at set intervals regardless of actual operational condition. This approach leads to over-servicing of healthy assets and misses failures that develop between scheduled visits. Predictive maintenance uses continuous sensor data and AI analytics to monitor equipment condition in real time, generating alerts and work orders only when data signals indicate developing degradation. This condition-based approach catches failures before they occur and eliminates unnecessary maintenance on assets that are performing within normal parameters.
Which hospital equipment categories have the highest downtime cost profiles?
MRI systems, CT scanners, surgical robots, linear accelerators, and core laboratory analyzers consistently generate the highest financial exposure when they experience unplanned downtime. These assets combine high utilization rates, high per-procedure reimbursement, and deep integration into clinical decision-making pathways — meaning their failure cascades across multiple departments simultaneously. Critical care life-support equipment carries a different risk dimension: patient safety and regulatory exposure that can trigger costly incident investigations independent of direct revenue impact.
What data is needed to conduct a healthcare equipment downtime analysis?
A comprehensive downtime analysis requires four core data sets: historical equipment maintenance records including all unplanned repair events and associated costs; procedure volume and reimbursement data for each high-value asset; documented operational impacts from past downtime events including clinical schedule disruptions and patient diversions; and current service contract terms to establish the baseline against which predictive maintenance ROI can be calculated. Most hospitals already have this data distributed across CMMS, EHR, and financial systems — the challenge is integrating it into a single analytical framework.
What is a realistic ROI timeline for implementing predictive maintenance on hospital equipment?
Most healthcare facilities begin detecting measurable ROI within the first three to six months of deployment as the AI platform begins intercepting developing equipment failures before they cause downtime. Full financial ROI — accounting for avoided emergency repairs, protected procedure revenue, and extended asset lifespans — is typically realized within 12 to 24 months of deployment. The ROI compounds annually as predictive models become more accurate and the maintenance program shifts a greater proportion of work from reactive emergency response to planned, scheduled intervention.
Can small and mid-sized hospitals justify the investment in predictive maintenance technology?
Yes — the financial case for predictive maintenance is proportional to equipment portfolio size, and a single avoided emergency failure event at a community hospital can generate sufficient cost avoidance to justify an entire year of platform subscription costs. Cloud-based predictive maintenance platforms eliminate on-premises infrastructure requirements, and modular deployment models allow smaller facilities to start with their highest-risk, highest-revenue assets and expand incrementally. The absence of a large capital budget is not a barrier when the initial deployment is scoped to the assets with the greatest downtime cost exposure.