Hotel general managers running on instinct and spreadsheets are leaving measurable performance on the table — not because their teams aren't working, but because the signals are buried in paper shift logs, fragmented work order systems, and disconnected department reports that never surface in time to act. A single delayed HVAC repair escalating into a guest complaint that drops your TripAdvisor score costs more in lost future bookings than the repair itself. A housekeeping bottleneck invisible in the data creates check-in delays every Friday that your front desk team absorbs silently. The properties consistently scoring above their competitive set on cost efficiency, guest satisfaction, and asset uptime share one operational trait — every department runs against live data, every work order is connected to an asset history, and every shift handover is structured, searchable, and actionable the moment it's logged. Sign up free on OxMaint to connect your hotel's shift logs, maintenance records, and operational KPIs into a single analytics platform built for hospitality operations teams.
Hotel Operations · Analytics · OxMaint
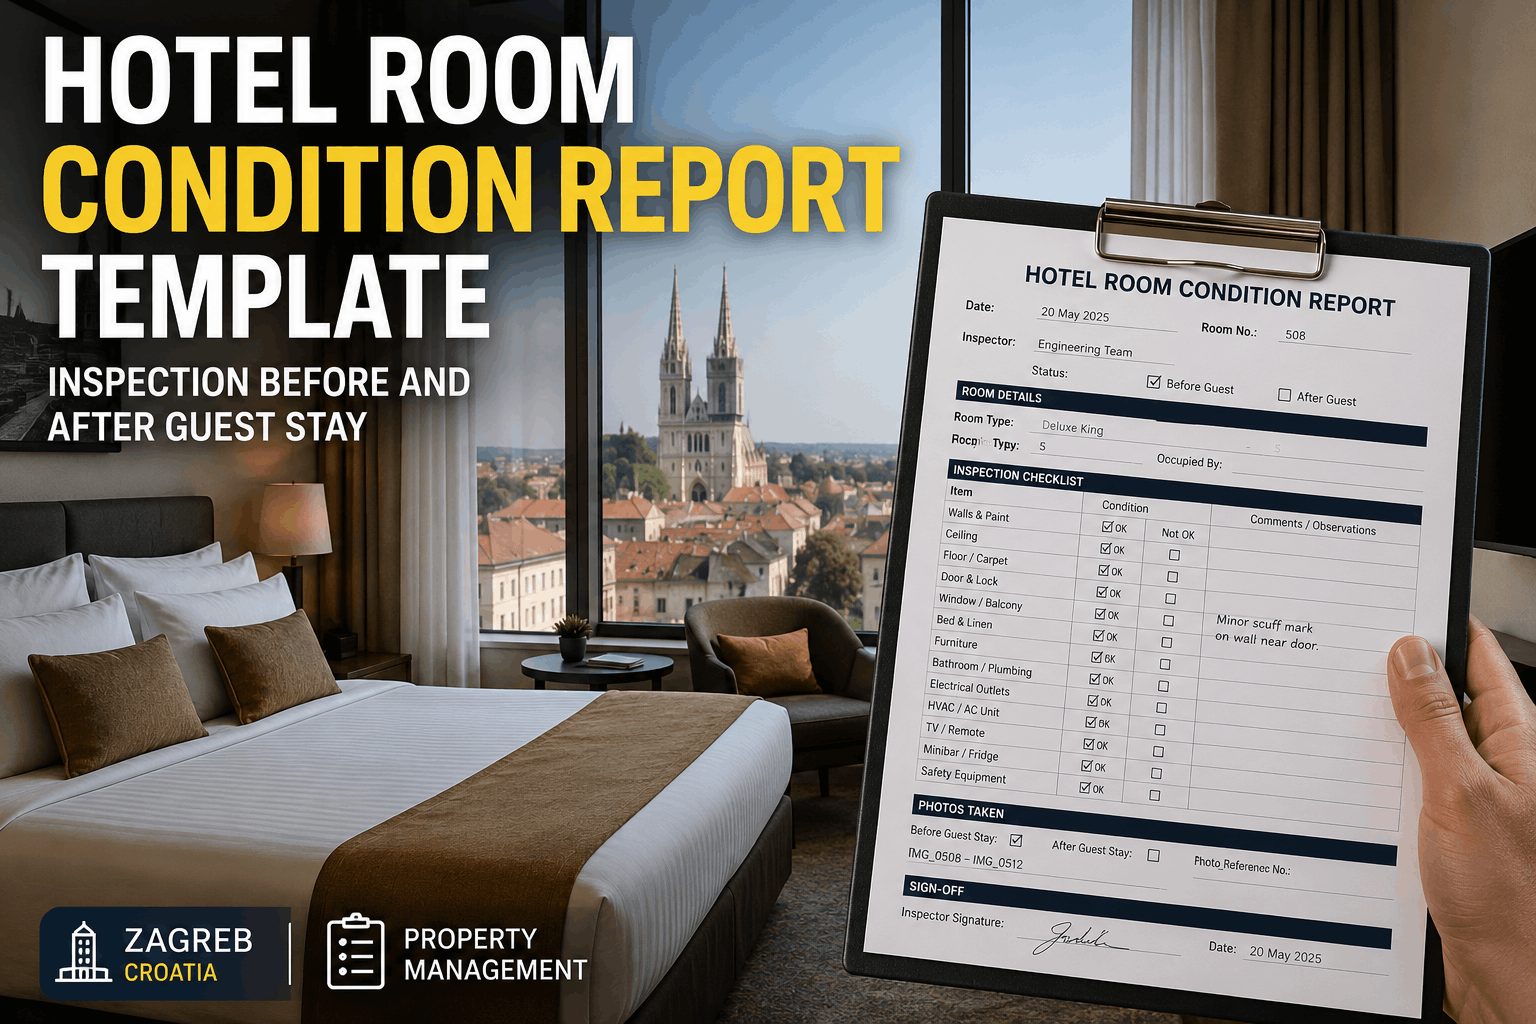
Data-Driven Hotel Operations
Management with Analytics
Shift logs, maintenance reports, and facility analytics connected into one intelligence layer — so every department head sees what's happening, what's at risk, and what to do next.
47%
of hotel equipment failures are preventable with condition-based monitoring
3.2x
faster issue resolution when teams operate with real-time analytics dashboards
28%
average reduction in annual maintenance spend with data-driven scheduling
91%
of hotel GMs say operational data access directly improves guest satisfaction
Why Most Hotels Still Cannot See Their Own Operations Clearly
The gap between a hotel that runs smoothly and one that firefights daily is rarely about staffing levels or budget — it is about data visibility. Most properties collect operational information constantly but store it in ways that make it functionally invisible: paper shift logs, WhatsApp groups, spreadsheets that never sync, and department heads who each track their own metrics in isolation.
01
Shift Handovers That Lose Information
Verbal handovers between engineering, housekeeping, and front desk teams create information black holes. Issues reported on the night shift never reach the morning maintenance supervisor. Guest complaints from Tuesday don't inform Wednesday's inspection rounds.
02
Reactive Maintenance Disguised as Normal
When every repair is triggered by a guest complaint or a visible failure, the cost is not just the repair — it is the downtime, the guest impact, and the emergency rate on contractor callouts. Hotels normalise this pattern because they have no baseline to compare against.
03
KPIs That Arrive After the Moment Has Passed
Monthly ops reports show what went wrong. They don't help you prevent the next occurrence. By the time a department trend appears in a spreadsheet, it has already affected guest satisfaction scores and operating costs for weeks.
04
No Asset History, No Predictive Power
Without a CMMS connecting work orders to individual assets, there is no way to identify which HVAC unit or kitchen equipment is approaching failure — until it fails. Predictive maintenance requires asset-level data history, and most hotels have none.
See Your Hotel's Operations the Way Top Performers Do
OxMaint connects every shift log, work order, and inspection record to a live analytics layer — giving your team the real-time picture that drives better decisions, faster responses, and measurably lower costs.
The 4 Analytics Pillars Behind High-Performing Hotel Operations
Data-driven hotel management is not one dashboard — it is four distinct information streams, each tied to a different operational outcome, all connected in a single platform. Hotels that operate at the top of their competitive set have all four running simultaneously.
Pillar 01
Shift Log Intelligence
Every handover note becomes structured, searchable, and linked to a room, asset, or department. Recurring issues surface automatically. Nothing gets lost between shifts — including the context that helps the next team member respond faster.
Timestamped entries
Asset-linked logs
Cross-shift search
Pillar 02
Maintenance Analytics
Work order history by asset, mean time to repair, open ticket aging, and technician productivity — all visible in one view. Predictive triggers fire before failure. SLA compliance is tracked automatically, not manually.
MTTR tracking
Predictive alerts
SLA compliance
Pillar 03
Operational KPI Tracking
Housekeeping turn times, inspection completion rates, room readiness delays, and engineering response windows — each department benchmarked, trended, and visible to managers who can actually act on the data in the moment it matters.
Live dashboards
Dept benchmarking
Trend alerts
Pillar 04
Guest Impact Correlation
Link operational events — delayed repairs, missed inspections, overdue work orders — to guest satisfaction score movements. Quantify what a 2-hour maintenance delay actually costs in review impact. Fix the operational root cause, not just the symptom.
Review correlation
Cost of delay data
Root cause flags
From Raw Operational Data to Decisions: How OxMaint Works
The path from a logged shift note or a completed inspection to an actionable operational insight should be automatic — not a manual analysis exercise done at the end of each month. OxMaint's analytics pipeline turns every input your team generates into structured intelligence in real time.
1
Capture
Staff log shift notes, work orders, inspections, and readings from mobile — structured, timestamped, and asset-linked from the first input.
2
Classify
Every entry is automatically tagged by department, asset, room, priority level, and category — creating a clean, queryable data layer without manual sorting.
3
Analyze
The analytics engine surfaces trends, response time deviations, recurring failures, and SLA breaches — flagging what needs attention before it escalates.
4
Act
Managers receive role-specific alerts. Work orders auto-assign to the right technician. Nothing waits for a weekly meeting to get addressed.
Live Operations Dashboard: What Your Hotel Looks Like on OxMaint
Every number your operations team needs — updated in real time, visible on any device, accessible to the right people at the right level of detail.
OxMaint Operations Center · Live View
Open Work Orders
12
▼ 34% vs last week
Avg Response Time
18min
▼ 22% improvement
SLA Compliance
96%
▲ 11pts this month
Predictive Alerts
3
Requires review
Department Performance Index
Hotel Analytics Readiness Checklist: 7 Capabilities Your Platform Must Have
Before investing in any hotel operations analytics platform, verify these seven capabilities are present — each one corresponds to a specific performance gap that most hotels carry without knowing it.
1
Mobile-First Digital Shift Logging
Shift notes captured on mobile with timestamps, room and asset tags, and department categorisation — not transcribed from paper after the fact. Real data starts with real-time capture at the point of observation.
Critical
2
Asset-Linked Work Order History
Every repair tied to a specific asset record with full cost, labour, and failure history. Without this, you cannot identify chronic problem assets, build replacement justifications, or generate meaningful predictive maintenance triggers.
Critical
3
Condition-Based and Predictive Alerts
Alerts triggered by asset usage hours, inspection readings, or anomaly patterns — not just calendar intervals. Calendar-based PM misses half the failures that happen between scheduled dates and wastes resources on assets that don't yet need attention.
Critical
4
Cross-Department KPI Dashboard
Engineering, housekeeping, front desk, and F&B performance visible in a single view — not in four separate systems. Cross-department visibility is where the most impactful operational improvements are discovered.
High
5
SLA and Compliance Reporting
Automated reports for brand standard audits, ownership reviews, and GM performance tracking — generated from actual operational data, not compiled manually the day before a meeting.
High
6
Guest Satisfaction Data Correlation
The ability to connect operational events — delayed work orders, missed inspections, repeat failures — to online review score movements. This turns guest feedback from a lagging indicator into an operational root-cause analysis tool.
High
7
Role-Based Access and Instant Alerts
Each manager sees their relevant data without noise from other departments. Critical alerts reach the right person immediately — not buried in an email digest reviewed the following morning.
Essential
What Changes in 90 Days: The OxMaint Hotel Analytics Timeline
Hotels adopting OxMaint's analytics platform follow a consistent performance trajectory. The pattern is predictable because the problems being solved are structural — and structural fixes compound over time.
All shift logs moved to digital capture
Asset register built and linked to work orders
Team onboarded, mobile app in use
Baseline KPIs established per department
First trend reports surface recurring issues
SLA compliance tracking live and visible
Response times drop an average of 20%
Cross-dept bottlenecks identified and addressed
Predictive alerts actively preventing failures
Maintenance cost reduction visible in budget
Guest satisfaction scores begin improving
Ownership reporting generated automatically
“
We used to find out about equipment failures when a guest called the front desk. Now OxMaint flags the risk three days before. That one change improved our engineering team's credibility with ownership more than anything we had done in two years.
— Director of Engineering, 4-star urban hotel, 380 rooms
Before and After: The Operational Shift That Analytics Creates
The difference between a data-driven hotel operation and a traditional one is not philosophical — it is visible in daily workflows, cost reports, and guest review trends within the first quarter.
Operational Area
Without Analytics
With OxMaint Analytics
Maintenance Response
Reactive, triggered by guest complaint, 4+ hour average
Predictive alerts, condition-based triggers, under 45 minutes
Shift Handovers
Verbal or paper-based, information lost between shifts
Digital, timestamped, searchable, linked to assets
Cost Visibility
Monthly manual reports, always last month's reality
Live maintenance spend dashboard, asset-level breakdown
Guest Issue Recovery
Discovered via online review, response is retrospective
Operational events flagged same shift, resolved before checkout
Team Accountability
Difficult to measure without time-consuming manual tracking
Auto-tracked via work order completion, KPI-linked
Audit & Compliance
Manual compilation before every review — days of effort
Auto-generated compliance reports from live operational data
Frequently Asked Questions: Data-Driven Hotel Operations
How long does it take to implement a hotel operations analytics platform?
OxMaint can be fully operational in a hotel within 30 days for properties up to 500 rooms. The onboarding process covers asset register setup, shift log template configuration, department KPI baseline setting, and mobile app training for all team members. Most hotels see their first actionable data trends within two weeks of go-live.
Start your free account to explore the setup process.
What operational data does a hotel analytics platform track?
A comprehensive hotel operations analytics platform tracks shift log entries and handover notes, work order creation and closure times, preventive maintenance completion rates, asset repair history and costs, room inspection completion rates, department-level KPI trends, SLA compliance by work order type, technician response and resolution time, and guest-impact event flags tied to operational incidents. OxMaint captures all of these in a single connected data layer.
Can analytics really improve hotel guest satisfaction scores?
Yes — and the mechanism is direct. Guest satisfaction scores in hotels are heavily influenced by room condition, response time to service requests, and consistency across stays. Each of these is an operational output traceable to specific maintenance workflows and shift log patterns. Hotels using OxMaint that move from reactive to predictive maintenance see measurable improvements in the maintenance-related guest review categories — typically within 60 to 90 days of consistent data-driven operations.
What is the difference between a CMMS and a hotel operations analytics platform?
A traditional CMMS manages work orders and maintenance schedules but stores data in ways that require manual extraction for analysis. A hotel operations analytics platform like OxMaint connects work order data to shift logs, inspection records, and department KPIs, then surfaces trends and performance benchmarks automatically in a live dashboard. The practical difference is that a CMMS tells you what happened; an analytics-connected platform tells you what is trending and what to do before it becomes a problem.
Book a demo to see the OxMaint analytics layer in action.
How do hotels measure ROI from operations analytics software?
The clearest ROI metrics are: reduction in unplanned maintenance spend (typically 20-30% in year one), decrease in average work order response time, improvement in SLA compliance percentage, reduction in repeat failures on the same assets, and improvements in maintenance-related guest review scores. OxMaint's reporting module tracks all of these against the baseline established in your first 30 days — making ROI reporting straightforward for ownership and management company presentations.
Start Running on Real Data
Every Shift. Every Asset. Every Department. Connected.
OxMaint gives hotel operations teams the analytics infrastructure to move from reactive firefighting to proactive management — with live dashboards, predictive maintenance alerts, structured shift intelligence, and automated compliance reporting built for hospitality.
No credit card required · Hotel onboarding in under 30 days · Full team access included