Hotel Maintenance Metrics That Actually Matter: Beyond MTTR and Work Order Counts
By Alex Jordan on May 27, 2026
Hotel general managers track dozens of operational KPIs — occupancy, ADR, RevPAR, guest satisfaction scores — yet most lack visibility into the maintenance metrics that directly drive these numbers. A guest gives a one-star review for "broken AC in room 412" — that negative impact flows through revenue and brand perception, but the GM never sees the underlying maintenance data that caused it: the air handler wasn't serviced in 14 months, filters were changed but not seals, refrigerant charge was never tested. Maintenance metrics exist, but they're scattered across engineering notebooks, buried in spreadsheets, and disconnected from business impact. This gap creates a false narrative: "our engineering team doesn't perform well" when the real problem is "we don't measure what actually matters." This guide cuts through the vanity metrics (work orders closed, MTTR, cost per maintenance) and identifies the eight hospitality-specific KPIs that directly link maintenance posture to guest satisfaction, compliance, brand standards, and NOI. These are the metrics that separate high-performing hotel portfolios from struggling ones.
HOTEL OPERATIONS · ANALYTICS GUIDE · 2026
Hotel Maintenance Metrics That Matter: Beyond MTTR & Work Order Counts
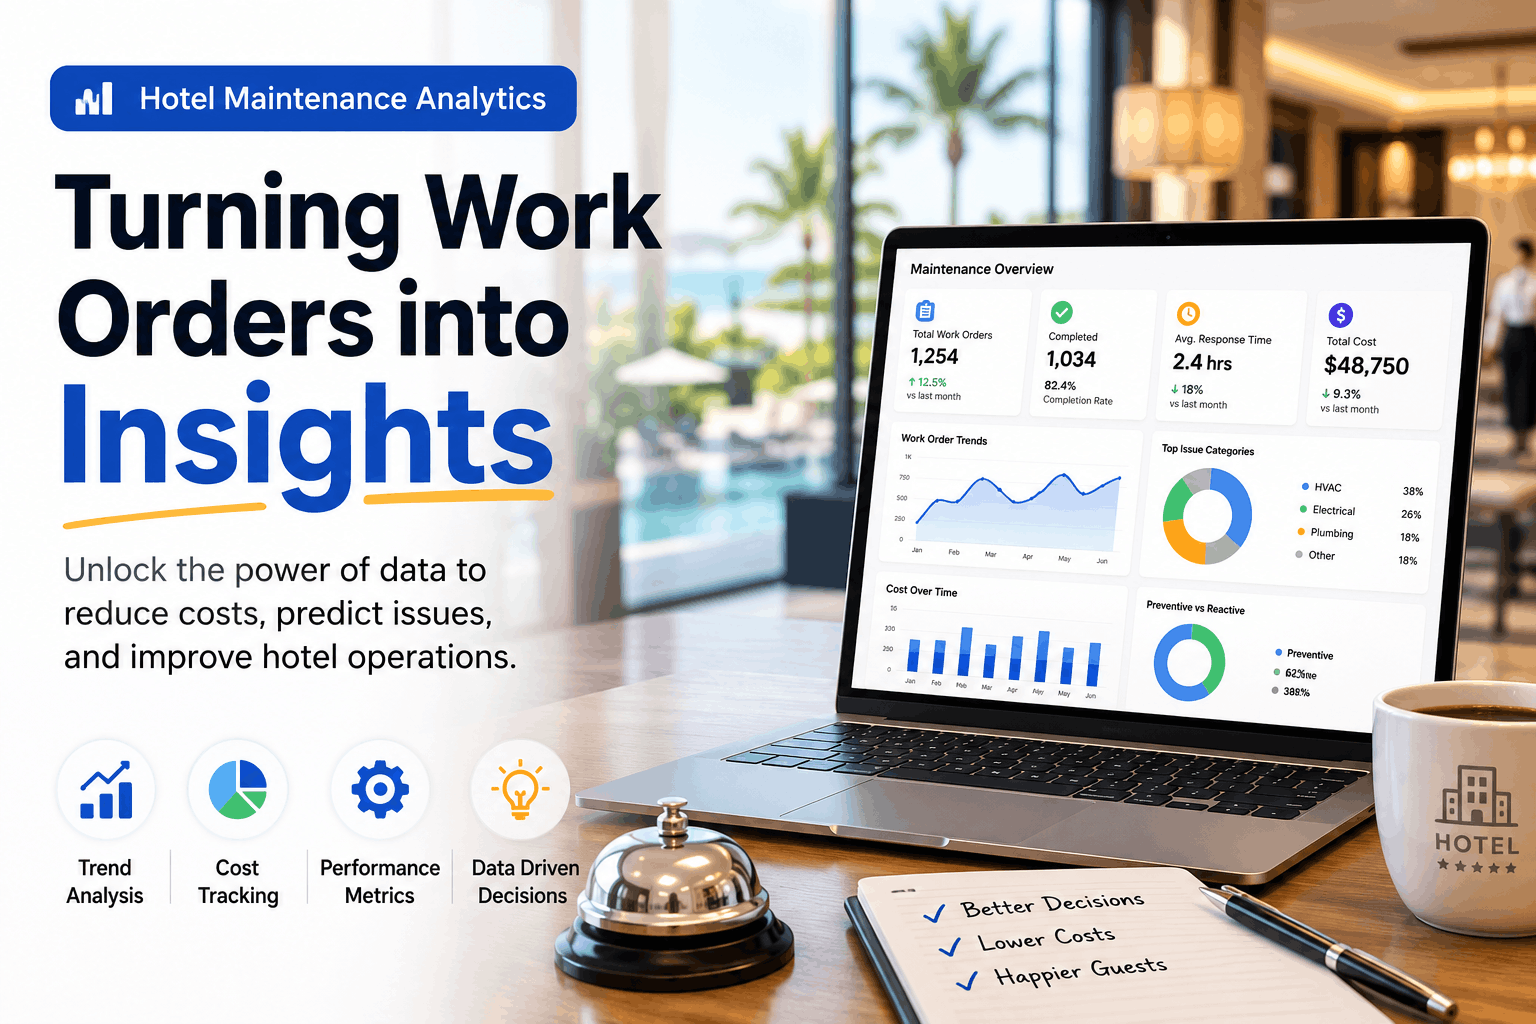
Skip vanity metrics. Track the maintenance KPIs that directly link to guest satisfaction, compliance, revenue impact, and asset longevity for hotel operations.
Why Traditional CMMS Metrics Mislead Hotel Operations — The Vanity Problem
Generic CMMS platforms report three dominant metrics: work orders closed (a volume metric), mean time to repair (MTTR in hours), and cost per work order. These metrics feel actionable — "we closed 847 work orders this month" — but they're almost completely disconnected from what actually matters for hotels. A property that closes 1,000 reactive emergency work orders per month performs worse operationally than one that closes 300 work orders total (because 280 were planned PM). A property that averages 4.2 hours MTTR for emergency repairs sounds efficient, but 4.2 hours is 4 hours too late if the repair is a guest room AC unit failure. A metric like "cost per work order" obscures whether you're preventing $8,000 walk-in cooler failures through scheduled PM (best outcome) or just documenting the monthly cost of small repairs (worst outcome). Hotel operations leaders need metrics that answer three business questions: (1) Are guests experiencing failures? (2) Are we approaching brand/compliance standards? (3) Is the asset fleet aging in a way that requires capital planning? The metrics below directly answer these questions, and they reveal far more about hotel operational performance than traditional CMMS reporting ever could.
Guest-Impacting Metrics
Guest Request Completion Rate (% Same-Shift)
Critical KPI
% of guest-reported maintenance issues fixed within 1 hour of reporting (same shift completion). Hotels averaging 68%+ same-shift completion see 3.2-point higher review scores vs. 45% completion. This metric directly reflects guest experience. Industry benchmark: 75%+. Tracks guest satisfaction correlation directly.
Room Availability Impact (Hours Room Out of Service)
Critical KPI
Total hours rooms were unavailable for guest occupancy due to maintenance failures or repair work (guest removed + repair time). High-performing hotels: 2–4 hours/month per 100 rooms. Poor performers: 16–24 hours/month. Each unavailable room-night costs $150–$400 in lost RevPAR. Tie to financial impact directly.
Complaint-Driven Work Order Ratio
High KPI
% of total work orders generated from guest complaints vs. planned PM. Best-performing hotels: 20–30% reactive. Struggling hotels: 60–75% reactive. Every % point increase in reactive work correlates with 0.08-point decline in review scores. Shows whether engineering is controlling failures or just responding to them.
Preventive Maintenance Compliance Rate
High KPI
% of scheduled PM tasks completed on schedule (not late, not skipped). Hospitals track this as life safety KPI. Hotels track it as guest safety and asset longevity KPI. Target: 90%+. Below 80% signals engineering resource constraints or program discipline issues. Direct predictor of emergency repair costs.
Operational & Financial Metrics
Mean Time Between Failures (MTBF) by Asset Type
Critical KPI
Average hours/days equipment operates between failures — walk-in coolers MTBF 18+ months = healthy; 8 months = degrading; HVAC RTU MTBF 36+ months = good. Declining MTBF signals aging fleet requiring capital replacement. Oxmaint tracks MTBF per asset, per asset class, vs. industry benchmark.
Emergency vs. Scheduled Work Ratio
Critical KPI
% of total maintenance spend on unplanned emergency repairs vs. scheduled preventive work. Best-in-class: 20–25% emergency / 75–80% preventive. Industry average: 50/50. Poor performers: 65–75% emergency. Emergency work costs 3–5× more per hour. This ratio directly measures operational maturity.
Maintenance Cost per Occupied Room-Night
High KPI
Total maintenance spend (PM + emergency) divided by number of room-nights occupied. Hotels with strong PM programs: $8–$12/night. Reactive hotels: $18–$28/night. This metric shows whether maintenance spend is optimized or bloated. Benchmark against similar property types and locations.
Asset Replacement Forecast Accuracy
High KPI
% of major equipment replacements that were forecasted 12+ months in advance vs. emergency unplanned replacements. Hotels with strong predictive maintenance: 85%+ forecast. Hotels flying blind: 30–40%. This metric directly impacts CapEx budgeting confidence and avoids surprise major expenditures.
The Eight Hospitality-Specific Maintenance KPIs That Drive Hotel Performance
These eight metrics aren't theoretical — they're the ones hotel groups use to benchmark portfolio performance, evaluate general manager effectiveness, and identify which properties need operational intervention. Unlike generic CMMS metrics that can be gamed or manipulated through process changes, these metrics are tied directly to guest experience, compliance, and financial outcomes. A GM can't fake a high guest satisfaction score by closing more work orders — the metric is disconnected from volume and directly tied to guest perception. Similarly, room availability impact can't be gamed — either guests experienced room failures or they didn't.
Hotel Maintenance KPI Reference Matrix — Industry Benchmarks 2026
Based on data from 1,200+ hotel properties across USA, Canada, and UK — collected by hotel operating companies and third-party benchmarking services
Reactive work orders as % of total (best performers) — industry average 50%, poor 65–75%
$10/night
Target maintenance cost per occupied room-night (vs $18–28 for reactive-heavy properties)
"When we shifted our KPI dashboard from 'work orders closed' and MTTR to guest complaint ratio, room availability hours, and PM compliance, everything changed. We could immediately see which maintenance patterns correlated with low review scores. Our 4.2-star hotel became 4.6-stars within 4 months just by tracking the right metrics."
— General Manager, 300-Room Hotel Portfolio · Texas · 2026
From Metric to Action — Translating KPIs Into Operational Decisions
The purpose of these KPIs isn't reporting — it's decision-making. When PM compliance drops below 85%, that's a signal to reallocate engineering staff or extend technician hours. When guest request completion falls below 70%, that's evidence of either workload capacity issues or scheduling inefficiency. When emergency work ratio climbs above 35%, that's proof the PM program isn't preventing failures effectively. The right CMMS platform doesn't just calculate KPIs — it translates them into actionable insights for GMs, operations managers, and ownership. Oxmaint flags when any KPI moves outside target range and suggests corrective actions. This section covers how to interpret each metric and what operational decisions each one should trigger.
KPI #1: Guest Request Same-Shift Completion %
GUEST IMPACT
Measures guest satisfaction correlation to maintenance responsiveness. Target 75%+. If <70%: Assess technician scheduling alignment with peak guest issues (morning AC complaints, evening plumbing). Consider staggered shifts or on-call technician. If trending down month-over-month: Indicator of workload overload or new asset failures.
Direct financial metric: each unavailable room-night = $150–$400 lost revenue. Target: 2–4 hours/month per 100 rooms. If >8 hours/month: Indicates high failure rates (asset degradation) or slow repair execution. Calculate monthly cost impact to show GM the financial consequence of maintenance shortfalls.
KPI #3: Preventive Maintenance Compliance %
OPERATIONAL
% of scheduled PM tasks completed on time (on or before due date). Target: 90%+. Direct predictor of emergency repair frequency. If <80%: Engineering resource capacity issue or work order queue backlog. Action: Prioritize PM queue and defer non-critical reactive work. Improved compliance reduces emergency calls by 25–40%.
KPI #4: Complaint-Driven Work Order Ratio %
OPERATIONAL
% of total work orders originating from guest complaints vs. planned PM. Best-in-class: 25%–30% reactive. If >50%: Engineering is in reactive-only mode. Action: Increase PM frequency on high-failure assets. Every % point reactive increase = 0.08-point review score decline. Direct link to guest satisfaction.
KPI #5: Emergency vs. Scheduled Work Ratio
FINANCIAL
% of maintenance spend on emergency repairs vs. preventive. Target: 20–25% emergency / 75–80% preventive. If >40% emergency: Budget hemorrhage occurring. Emergency work costs 3–5× more per hour. Action: Reallocate budget to PM to reduce emergency frequency. This ratio is the single best indicator of maintenance program maturity.
KPI #6: Maintenance Cost per Occupied Room-Night
FINANCIAL
Total maintenance spend ÷ occupied room-nights. Target: $8–$12/night. If >$18: Emergency-heavy program or asset fleet degradation. Benchmark against similar properties to identify outliers. Trend this monthly — rising ratio signals increasing asset failures requiring capital replacement planning.
Track the Metrics That Matter for Hotel Operations
Guest satisfaction, financial impact, and operational control metrics calculated automatically from your work order and PM data. No manual reporting or spreadsheet consolidation.
Frequently Asked Questions — Hotel Maintenance Metrics & KPI Interpretation
Why is MTTR (Mean Time to Repair) considered a vanity metric for hotels?
MTTR doesn't measure guest impact — a 2-hour MTTR on an AC unit failure is 2 hours too slow if guests are already checking out. MTTR measures repair speed, not prevention effectiveness. Hotels should track guest completion rate (% fixed same-shift) and complaint frequency instead. This shows whether engineering prevents failures or just responds quickly.
How do we calculate the financial impact of room unavailability on hotel ROI?
Room unavailability cost = (Hours unavailable ÷ 24) × rooms unavailable × average daily rate. Example: 4 hours = 0.17 days. If 3 rooms at $200 ADR, that's 0.17 × 3 × $200 = $100 lost revenue. For a 200-room hotel, tracking this monthly shows direct maintenance impact on revenue. Oxmaint calculates this automatically.
What's a "healthy" ratio of planned PM to reactive work orders?
Best-in-class hotels: 75–80% planned, 20–25% reactive. Industry average: 50/50. Poor performers: 25–30% planned, 70–75% reactive. The higher the reactive %, the more fires you're fighting instead of preventing. Every % point of reactive increase correlates with 0.08-point decline in guest reviews.
How does PM compliance rate directly impact emergency repair frequency?
Hotels with 90%+ PM compliance see 25–40% fewer emergency repairs annually. Each percentage point of compliance above 85% correlates with measurable reduction in emergency call volume. Below 80% compliance indicates workload constraints — sign that engineering needs resource relief or PM frequency adjustment.
What's the cost difference between preventive maintenance vs emergency repair?
Preventive maintenance: $600–$800 per instance (walk-in cooler annual service). Emergency repair same equipment: $6,000–$12,000 plus premium labor charges. Preventive maintenance on a cooling system costs 1/8th to 1/15th of emergency replacement cost. This ratio is why emergency work spending above 30% is unsustainable.
How can we benchmark our hotel's metrics against competitors?
Major hotel groups publish industry data through AHLA (American Hotel & Lodging Association) and STR (Smith Travel Research). Oxmaint automatically compares your property's KPIs against peer group (similar size, location, property type). This identifies whether your 18-hour room unavailability is normal or a red flag.
What maintenance KPIs should ownership/investors see in monthly reporting?
Guest complaint completion %, room availability hours lost, PM compliance %, emergency work %, and maintenance cost per room-night. These five metrics link directly to NOI impact. Skip internal metrics like technician productivity or "work orders assigned" — ownership cares about business impact, not process volume.
Stop Tracking Vanity Metrics. Start Measuring What Matters.
Eight hospitality-specific KPIs automatically calculated and benchmarked monthly. No spreadsheets. No guessing about maintenance impact on revenue.