Your CMMS already contains the data that reveals your hotel's maintenance opportunities — the problem is that 79% of hotel operators never analyze it for actionable insights. Every work order your team has completed, every hour they have logged, every part they have replaced over the past 24 months contains patterns that repeat with statistical regularity across equipment types, shift patterns, and seasonal cycles. A 2024 hospitality technology report found that hotels using work order data analytics reduced maintenance costs by 22% and improved guest satisfaction scores by 14 points — not by installing new sensors or buying AI platforms, but by systematically mining the work order data they already had. The HVAC unit that generates 40% more work orders than comparable units is not a random anomaly — it is the third unit on that property with the same failure pattern, and the previous two were resolved with proactive maintenance that eliminated recurring issues. That pattern is sitting in your CMMS right now, invisible because nobody has built the analytics that surfaces it. Oxmaint's analytics module turns your work order history into an insight engine — automatically identifying cost drivers, flagging recurring failures, and generating actionable intelligence before problems compound. The data is already yours, and the analysis that reduces your next maintenance budget takes minutes to configure, not months. If your hotel is still using work orders only for task tracking instead of data-driven decisions, start a free trial or book a demo to see how Oxmaint surfaces actionable insights from your existing work order data.
Hotel Maintenance Data Analytics: Turning Work Orders into Insights
Work order data holds valuable insights — learn how to analyze maintenance data for cost reduction, performance improvement, and data-driven decision making.
You Already Have the Data — You Just Need the Analytics
Every work order in your CMMS is a data point. Every repair cost is a spending signal. Every response time is a performance indicator. Oxmaint does not require new sensors or data science consultants — it analyzes the work order data you have already been collecting and surfaces the insights that drive cost reduction and performance improvement. Hotel operations leaders ready to unlock the value in their maintenance data can start a free trial or book a demo to see how Oxmaint turns work orders into insights from your actual data.
Why Work Order Data Analytics Matters for Hotels
Hotel maintenance departments generate vast amounts of work order data — thousands of completed tasks, labor hours logged, parts consumed, and costs incurred every year. Yet most hotels treat each work order as an isolated transaction rather than a data point in a larger pattern .
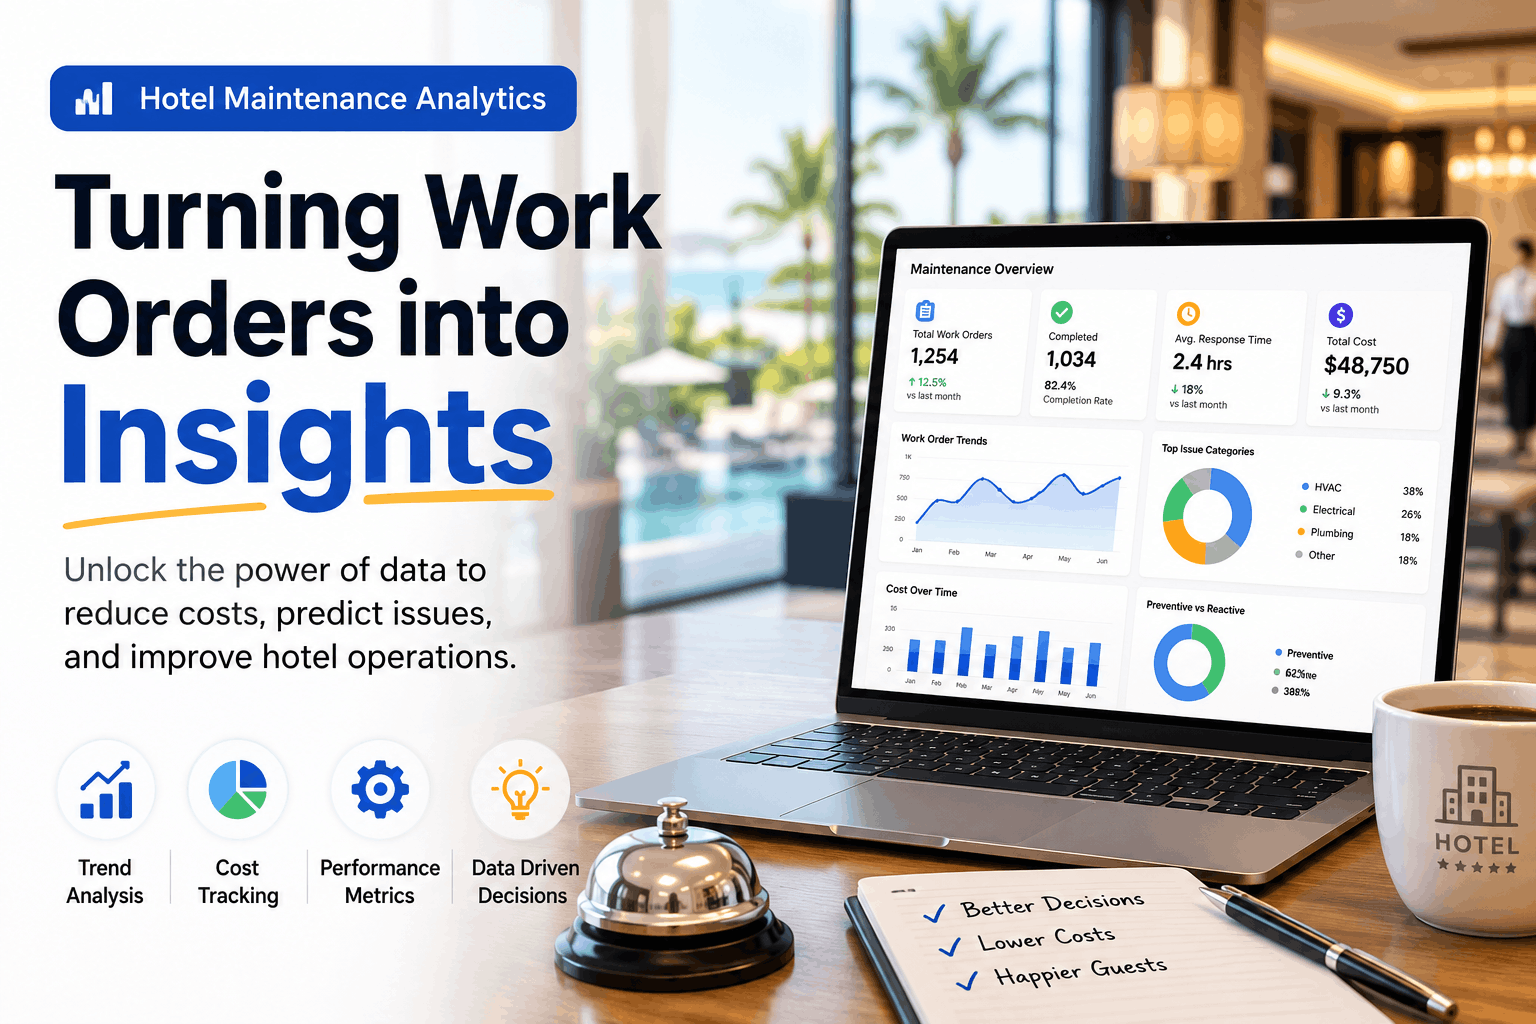
The opportunity lies in moving from descriptive analytics to predictive and prescriptive analytics. Descriptive analytics tells you what happened — how many work orders were completed, total costs, average response time. Predictive analytics tells you what will happen — which equipment is likely to fail, which costs will escalate. Prescriptive analytics tells you what to do about it — proactive maintenance schedules, resource allocation, and budget planning. Hotels that master all three levels of analytics achieve the 22% cost reduction and 14-point guest satisfaction improvement documented in hospitality industry studies .
The Five Work Order Data Categories That Drive Insights
Every work order contains multiple data elements that, when aggregated and analyzed, reveal patterns and opportunities. The five categories below represent the most valuable data sources for hotel maintenance analytics .
Categories 4 & 5 — Technician Performance and Preventive vs. Reactive Mix
The remaining two data categories evaluate workforce effectiveness and maintenance strategy balance — critical factors in cost and guest experience outcomes .
Work order completion by technician: productivity rate, quality metrics (callbacks), and skill utilization. The data reveals which technicians are most effective on different task types, where training is needed, and how to allocate resources for optimal results .
Percentage of work orders that are planned (PM) vs. reactive (emergency/breakdown). This ratio is the single best indicator of maintenance program health — hotels below 30% preventive work are in crisis, while hotels above 50% are realizing the benefits of planned maintenance .
The Analytics Dashboard — Key Metrics to Track
Effective maintenance analytics requires tracking the right metrics. The dashboard below identifies the key performance indicators that drive insights and improvement decisions .
| Metric Category | Key Metrics | Why It Matters |
|---|---|---|
| Cost & Spend | Cost per work order, labor cost by task type, parts cost by equipment | Identifies cost drivers and savings opportunities |
| Response & Completion | Average response time by priority, completion rate by deadline | Measures operational efficiency and guest impact |
| Reliability & Failure | MTBF, failure frequency by asset type, repeat repair rate | Identifies problematic equipment and preventive opportunities |
| Workforce | Work orders per technician, callback rate, training compliance | Measures team effectiveness and development needs |
| Program Health | Preventive vs. reactive ratio, PM completion rate, backlog size | Indicates overall maintenance program maturity |
Turning Data into Action — The Analytics Workflow
Work order data analysis follows a structured workflow that transforms raw data into actionable insights. The workflow below outlines the four steps that turn work orders into intelligence .
Ensure every work order captures essential fields: asset identification, task type, priority, completion time, parts used, labor hours, and cost. Standardized data entry is the foundation of effective analytics.
Aggregate data by time period (monthly, quarterly, annual), location, asset type, and technician. Identify trends, patterns, and outliers. Calculate key metrics and compare against benchmarks.
Translate analysis into actionable insights — cost drivers, reliability issues, performance gaps. Prioritize insights by impact on guest satisfaction, operational efficiency, and cost.
Develop action plans based on insights. Track progress against key metrics and adjust approach based on results. Continuous monitoring identifies new patterns and validates improvement efforts.
Five Critical Insights Your Work Order Data Will Reveal
When you analyze work order data systematically, five categories of insights emerge. Each insight type drives different improvement actions and delivers specific business value .
In most hotels, 20% of assets generate 80% of maintenance costs. Work order data reveals which equipment types, locations, and systems are driving the majority of spend — enabling targeted improvement investments where they will have the greatest impact .
Equipment that generates repeat work orders for the same issue indicates a systemic problem — equipment selection, installation quality, maintenance approach, or operating conditions. Work order data reveals which assets are "repeat offenders" and drives root cause investigation and prevention .
Technician performance varies significantly across individuals, shifts, and task types. Data reveals which technicians are most effective on different work types, where training gaps exist, and how to optimize resource allocation for maximum efficiency.
Maintenance demand varies by season (HVAC failures in summer/winter), day of week (weekend vs. weekday patterns), and time of day. Work order data reveals demand patterns that enable proactive staffing, parts stocking, and preventive maintenance scheduling.
Hotels with higher PM completion rates experience fewer failures and lower total maintenance costs. Work order data reveals the specific assets and systems where PM compliance is most important, enabling prioritization of preventive maintenance resources.
ROI of Work Order Data Analytics
Hotels using work order analytics reduce maintenance costs by identifying and eliminating waste, optimizing vendor spend, and preventing recurring issues
Data-driven maintenance reduces guest-impacting failures and improves response times — directly improving satisfaction scores
Identifying failure patterns enables preventive maintenance that eliminates emergency repairs before they occur
With 12+ months of work order data, Oxmaint surfaces the first actionable insights within 90 days
Frequently Asked Questions
What is hotel maintenance data analytics?+
What are the most important metrics to track in hotel maintenance analytics?+
How do I start analyzing my hotel's work order data?+
What insights can I expect from work order data analysis?+
Your Work Orders Are Data — Turn Them into Insights
Every work order your hotel has ever completed contains a piece of the pattern that reveals cost drivers, performance gaps, and improvement opportunities. Oxmaint's analytics module analyzes your work order data against hospitality-specific benchmarks automatically, generating the insights that drive cost reduction and guest satisfaction improvement. No data scientists. No complex tools. Import your data, analyze your patterns, and start making data-driven decisions in your first 30 days.