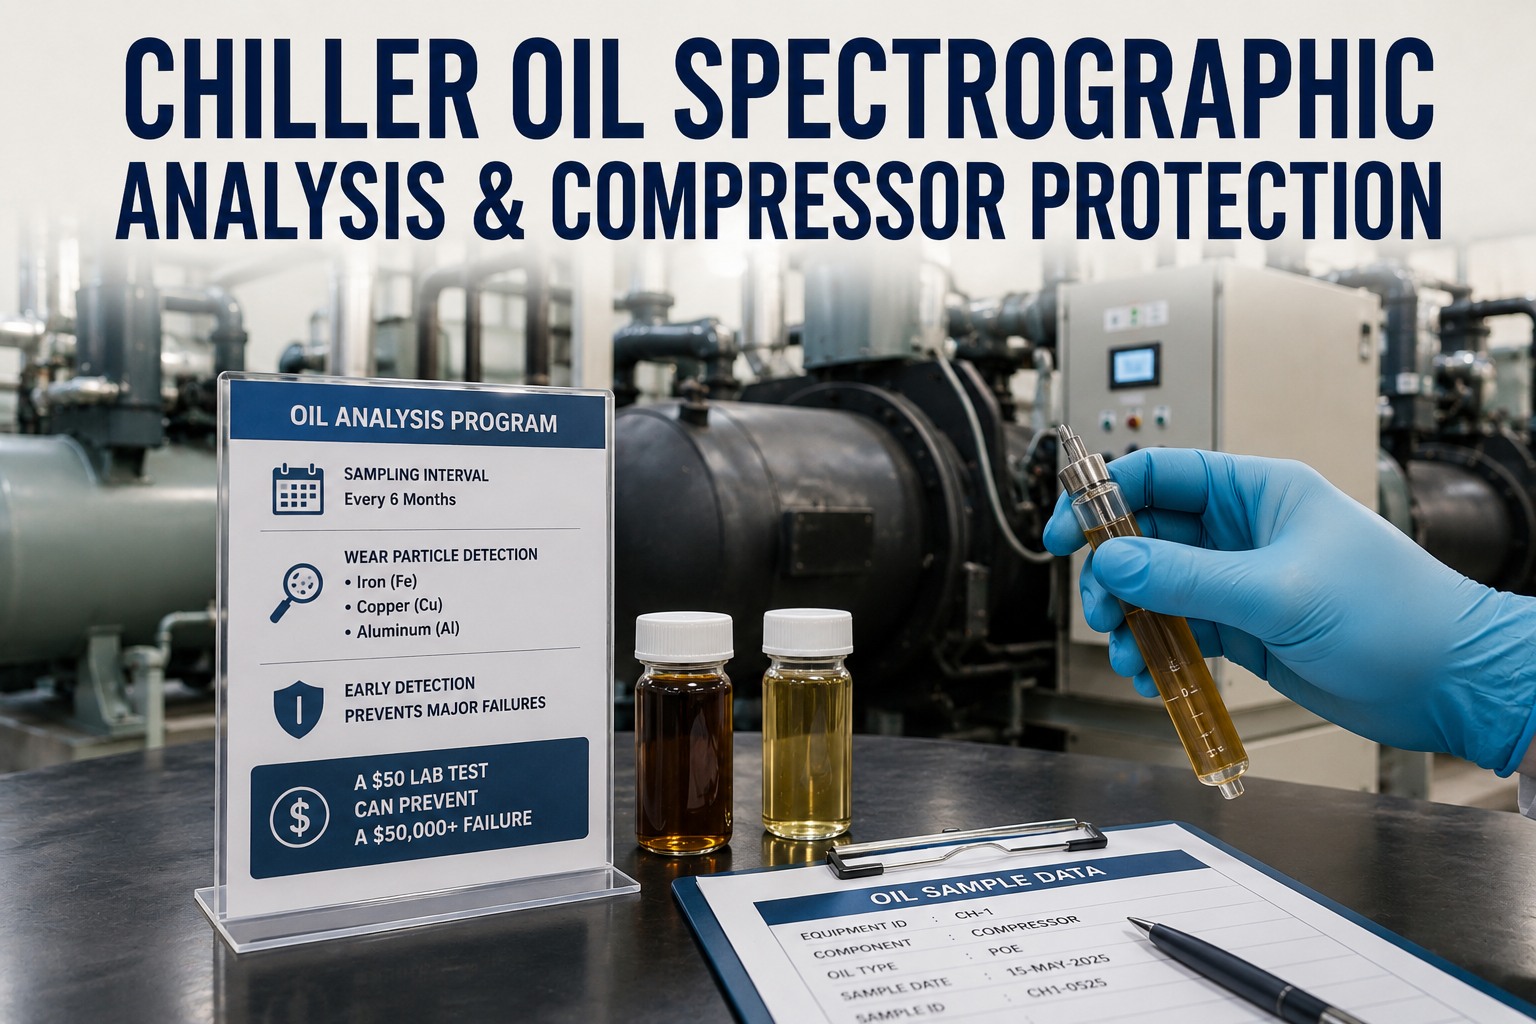
Chiller compressor failures rarely arrive without warning — the wear metals, refrigerant dilution and additive depletion that precede a seizure are all readable in a single 50 mL oil sample. A disciplined spectrographic analysis program run on a 6-month interval typically catches 80–90% of developing faults while the repair is still a $400 oil change instead of a $28,000 compressor swap. This guide walks through the sampling cadence, the elements worth tracking, the action thresholds used by ABS-rated labs, and how to wire the results into a CMMS work-order flow. Ready to automate the whole program? Start Free Trial and turn every sample bottle into a triggered work order.
Can a $50 lab bottle stop your next $28,000 compressor rebuild?
Spectrographic oil analysis detects iron, copper and aluminum wear particles months before vibration, current-draw or oil-pressure alarms register — giving your team a serviceable window to act. Plants that sample every 6 months report 4× fewer catastrophic chiller failures and 20% lower annual lubricant spend.
What the elements in your chiller oil are telling you
Every metallic surface inside a chiller compressor leaves a chemical fingerprint in the lubricant. Inductively Coupled Plasma (ICP-AES) spectroscopy quantifies 20+ elements in parts-per-million; the pattern — not any single number — tells you which component is failing and how fast.
Iron (Fe)
Tracks steel-on-steel wear in gear sets, shaft journals and roller bearings. A sustained rise above 40 ppm on screw chillers typically points to bearing race spalling or thrust washer degradation. Trend velocity matters more than the absolute value.
Copper (Cu)
Sheds from bushings, motor windings and brass oil-pump components. Copper above 30 ppm often signals oil-pump bushing wear or, on hermetic units, electrical-winding varnish breakdown — frequently paired with rising aluminum.
Aluminum (Al)
Originates from pistons (reciprocating units), impeller hubs (centrifugal) and cage-style bearings. Aluminum trending with iron usually confirms thrust-bearing distress; on centrifugal chillers it can flag impeller-eye rub.
The 6-month timeline that catches failures early
Most centrifugal and screw chiller OEMs — Carrier, Trane, York — recommend oil analysis at every 4,000 operating hours or every 6 months, whichever comes first. The worked timeline below shows how a single elevated iron reading at month 6 unfolds across a year if action is taken versus deferred.
Baseline sample drawn
Pull 50 mL from the pressurized oil line while the compressor is at full load — never from the cold sump. Record hours, refrigerant type and last oil top-off. This becomes the trend baseline for every subsequent sample.
Iron climbs to 47 ppm
ICP-AES returns iron at 47 ppm against a 12 ppm baseline. No vibration change yet, no oil-pressure deviation. A proactive team schedules a bearing inspection at the next planned outage; a reactive team files the report and moves on.
Interim confirmation sample
Because the trend was flagged, a confirmatory sample is pulled early. Iron now reads 89 ppm with rising copper — a thrust-bearing race is confirmed. The compressor is scheduled for a $4,200 bearing swap during the next 3-day outage window.
Outcome divergence
Proactive path: chiller runs through summer at full load, total spend $4,650 (test + bearing kit + labor). Reactive path: seized compressor at peak load, emergency rebuild $28,500, plus 9 days of rented mobile cooling at $6,200/day. Same machine, same oil, same $50 test — different outcome.
What a 10-chiller portfolio actually saves per year
Oil analysis is one of the few maintenance investments with a measurable, defensible return. The formula below uses a 10-chiller commercial plant — a realistic mid-size campus or hospital — and conservative failure rates from ASHRAE RP-1043 field data.
| Portfolio Size | Annual Sample Cost | Faults Caught / yr* | Avoided Rebuild Cost | Net Program Payback |
|---|---|---|---|---|
| 5 chillers | $500 | 0.5 | $11,000 | $10,500 |
| 10 chillers | $1,000 | 1.0 | $22,000 | $21,000 |
| 25 chillers | $2,500 | 2.5 | $55,000 | $52,500 |
| 50 chillers | $5,000 | 5.0 | $110,000 | $105,000 |
*Based on ASHRAE RP-1043 field-failure frequency of ~10% per chiller per year for units over 10 years old; assumes 50% of faults are catchable by spectrography.
Turn every oil sample into a triggered work order
Oxmaint ingests lab PDFs, parses wear-metal trends, and auto-opens a CMMS work order the moment iron or copper crosses your threshold — no spreadsheets, no missed month-9 samples.
Action thresholds for the four most-watched wear metals
These action bands are drawn from ISO 4406 cleanliness targets combined with typical OEM service limits for centrifugal and screw chillers on POE and mineral oils. Use them as a starting baseline, then refine against your own 12-month trend.
| Element | Normal | Monitor | Action | Critical | Likely Source |
|---|---|---|---|---|---|
| Iron (Fe) | 0–20 ppm | 21–50 ppm | 51–100 ppm | >100 ppm | Journal / roller bearings, gear set |
| Copper (Cu) | 0–10 ppm | 11–30 ppm | 31–60 ppm | >60 ppm | Bushings, pump wear, motor windings |
| Aluminum (Al) | 0–5 ppm | 6–15 ppm | 16–30 ppm | >30 ppm | Pistons, impeller hub, cage bearing |
| Silicon (Si) | 0–10 ppm | 11–20 ppm | 21–40 ppm | >40 ppm | Ingressed dust / desiccant dust |
Baseline before you trend
A single sample is a snapshot; two samples six months apart is a trend. Never act on one elevated reading without confirming the direction of travel.
Velocity beats absolute
Iron climbing from 12 to 47 ppm in 90 days is more urgent than a steady 60 ppm for two years. Trend slope, not just the number, drives the work order.
Pair with oil chemistry
Read wear metals alongside moisture, viscosity and acid number. A 60 ppm iron reading with 80 ppm water tells a very different story than 60 ppm iron alone.
Auto-trigger the CMMS
A lab report sitting in an inbox saves nothing. Wire the threshold directly into your CMMS so an Action-band reading opens a work order within 24 hours.
A 180-asset hospital campus, one cooling season
We caught a thrust-bearing failure on a 1,200-ton York YK chiller at month 7 — iron at 94 ppm, copper climbing. The $4,800 bearing swap during a planned April outage replaced what would have been a $31,000 emergency rebuild in July, plus an estimated $74,000 in rented mobile cooling and lost OR revenue.
Chiller oil spectrographic analysis — answers that matter
How often should I sample chiller oil?
Most OEMs specify every 4,000 operating hours or every 6 months, whichever comes first. For critical or heavily loaded centrifugal chillers in continuous process duty, a 3-month interval is prudent. Always sample at full load and operating temperature — a cold-sump sample under-represents suspended wear metals and over-represents settled contamination. Ready to automate cadence and threshold alerts? Start Free Trial and Oxmaint will track every chiller's sampling clock for you.
What does a $50 spectrographic test actually measure?
A standard ICP-AES panel quantifies 20+ wear and additive elements — Fe, Cu, Al, Cr, Pb, Sn, Si, Na, B, Zn, P, Ca, Mg — in parts-per-million, plus moisture (Karl Fischer), viscosity at 40 °C, total acid number (TAN), and ISO 4406 cleanliness code. Some labs add ferrography for large-particle detection, which ICP-AES alone misses above ~8 microns.
Can oil analysis detect refrigerant dilution?
Yes. Refrigerant dilution shows up as a viscosity drop — typically 10–15% below the nominal ISO grade — and is confirmed by a flash-point test. On POE lubricants in low-pressure chillers, sustained dilution washes the bearing film and accelerates iron and copper wear; catching it early allows a purge and oil change before the bearing surfaces are compromised.
Should I sample if my chiller is under a manufacturer service contract?
Absolutely. OEM contracts typically cover scheduled oil changes, but the lab report is your independent record of machine health — and your evidence base if a warranty or contract dispute arises. Maintain your own trend file in parallel; if the OEM skips a sample, the gap is visible. Book a Demo to see how Oxmaint consolidates OEM and in-house lab reports into one trend view.
What is the single biggest mistake in chiller oil sampling?
Pulling the sample from the drain valve after shutdown. The oil sitting in the sump has already shed its heaviest wear particles, so the reading under-reports true bearing wear by 40–60%. Always sample from a pressurized tap on the supply line upstream of the filter, with the compressor at full load, into a clean dry bottle flushed with a little sample oil first.
Stop reading lab reports. Start acting on them.
Deploy a complete chiller oil-analysis workflow in under 30 minutes — sample cadence, threshold alerts, auto-generated work orders, and 12-month trend dashboards for every compressor in your portfolio.
Free 14-day trial · No credit card