A hydronic pump that's running badly rarely looks like it. It hums along, moves some water, and quietly wastes energy, cavitates, or wears out years early — and you'd never know from the outside. The pump curve is how you see it: plot where the pump is actually operating against where it was designed to, and the deviation tells you exactly what's wrong. This article explains how to read a pump curve, measure the operating point, and diagnose the fault — and how to trend it as predictive maintenance in OXMAINT AI — or book a demo of pump condition monitoring in OXMAINT AI.
A pump running off its design point burns energy, risks cavitation and wears out early — and none of it shows without plotting the operating point. OXMAINT AI is the AI-powered CMMS that logs pump head, flow and power readings, trends the operating point against the curve, and raises a work order when it drifts — so a failing pump is a predicted repair, not a flooded plant room.
best efficiency point — where the pump is happiest and longest-lived
H×Q
head against flow — the two axes that define the pump's behavior
TDH
total dynamic head from suction and discharge pressure gives the operating point
n³
power scales with the cube of speed — the affinity law behind VFD savings
Anatomy of a Pump Curve
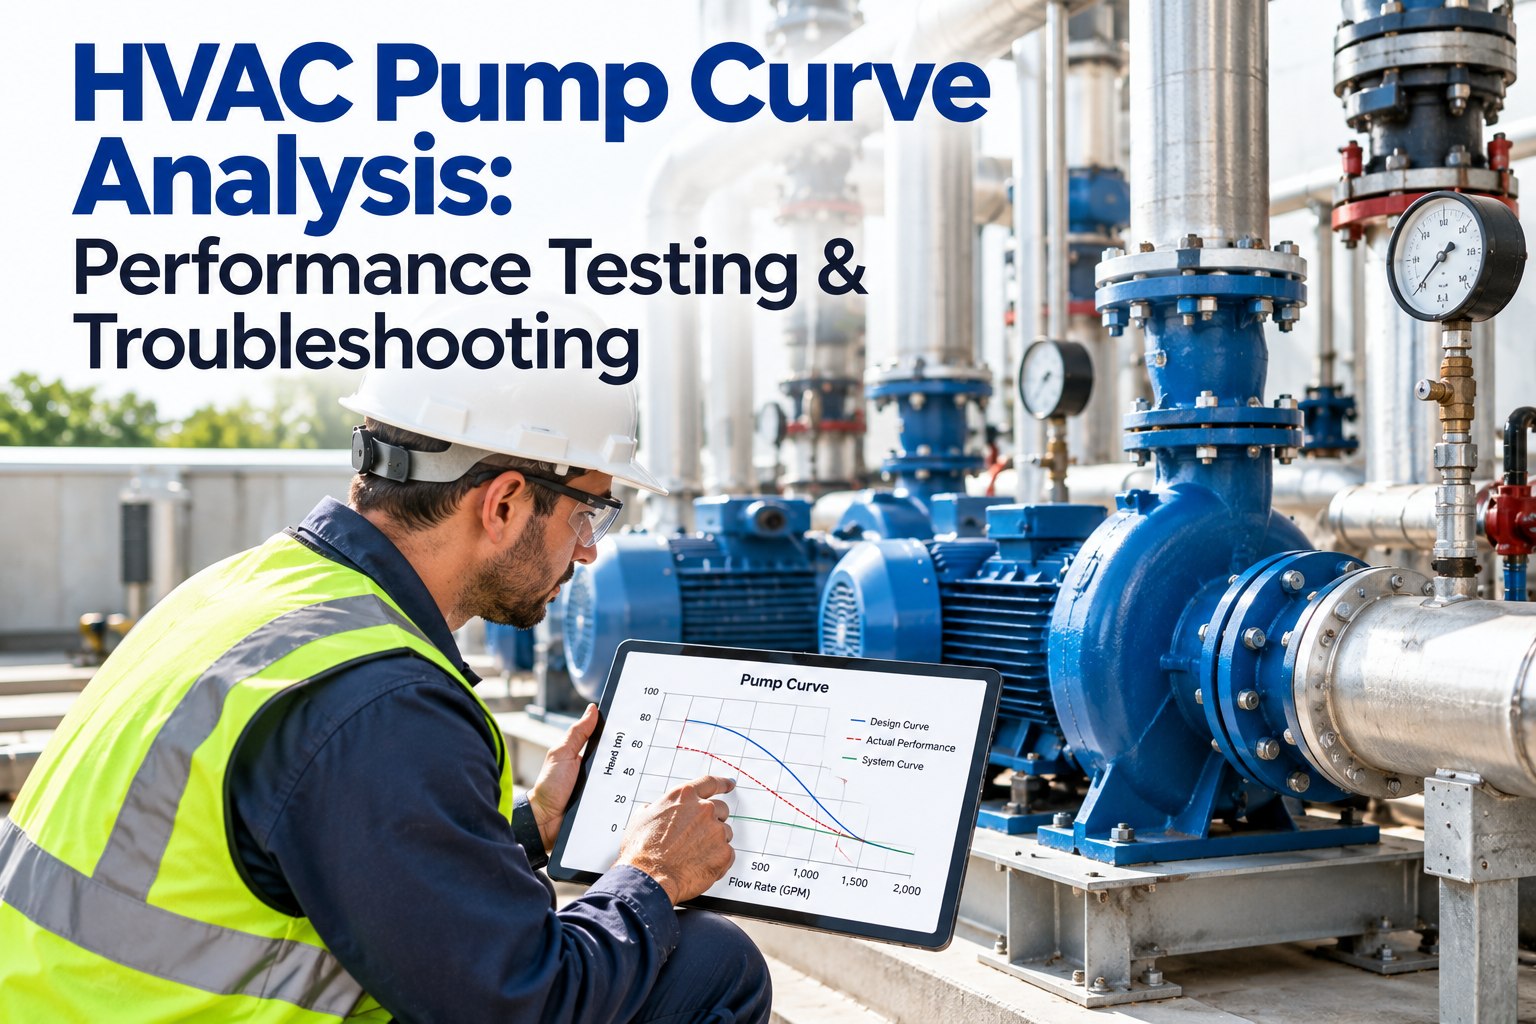
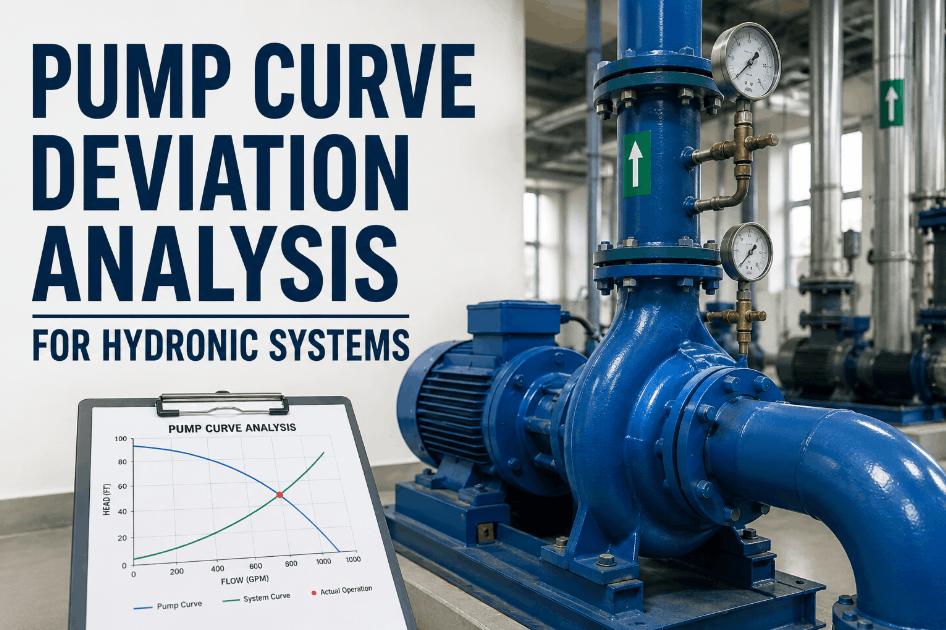
Every centrifugal pump has a characteristic curve: as flow rises, the head it can produce falls. The system has its own curve — resistance rising with flow — and where the two cross is the operating point, the real flow and head the pump delivers. The best efficiency point (BEP) is where you want it to land. Start free and log each pump's curve and readings in OXMAINT AI.
Move the system curve — open or throttle a valve, clog a strainer — and the operating point slides along the pump curve. Where it lands is the diagnosis.
Reading the Operating Point
Where the operating point sits relative to the BEP is the fastest read on pump health. Three zones, three different stories.
Right of BEP
High Flow, Low Head
System resistance fell away — a valve wide open, an oversized pump, a lost restriction. Risks motor overload and cavitation (runout).
Left of BEP
Low Flow, High Head
System resistance rose — a throttled or closed valve, a clogged strainer, fouled piping. Risks overheating and low delivery.
Below the Curve
Can't Make Head
The pump itself is failing — a worn impeller or wear rings, trapped air, wrong speed or reversed rotation.
Gauges on both sides of the pump, with it running at normal conditions.
2
Calculate total dynamic head
Convert the pressure difference across the pump to feet of head — that's the head axis.
3
Measure the flow
From a flow meter, a balancing valve reading, or the pump's own differential-pressure method — that's the flow axis.
4
Plot against the curve
Mark head and flow on the manufacturer's curve and see where it falls versus the BEP and the design point.
5
Check motor power
Compare measured amps or kW to the curve's power line — a cross-check on where the pump really sits.
Symptom to Curve Signature: Troubleshooting
Once the operating point is plotted, the deviation maps to a cause. This matrix runs the common ones from what you observe to what to do about it.
Symptom
Curve signature
Likely cause
Action
High flow, low head
Runout, right of BEP
Open bypass, oversized pump, lost resistance
Throttle or trim; verify valve lineup
Low flow, high head
Left of BEP
Clogged strainer, throttled or shut valve, fouling
Clean strainer; check valve positions
Head below the curve
Under the curve at all flows
Worn impeller or wear rings, wrong speed
Inspect internals; verify speed and rotation
Noise, vibration, pitting
Operating far off BEP
Cavitation — insufficient NPSH available
Raise suction pressure; reduce lift or losses
No or little flow
Off the curve entirely
Air-bound, reversed rotation, closed suction
Prime and vent; confirm rotation direction
Rising power draw
Point creeping right over time
System drift or wear raising demand
Trend it; plan service before overload
Affinity LawsWhy Slowing a Pump Saves So Much
On a variable-speed pump, flow, head and power don't change at the same rate when you change speed — and that's the whole case for VFDs on hydronic systems.
Flow
∝ speed
Head
∝ speed²
Power
∝ speed³
Halve the speed and flow halves — but power drops to roughly an eighth. Trimming speed to real demand is where hydronic pumping energy is won.
From Spot Check to Predictive Maintenance
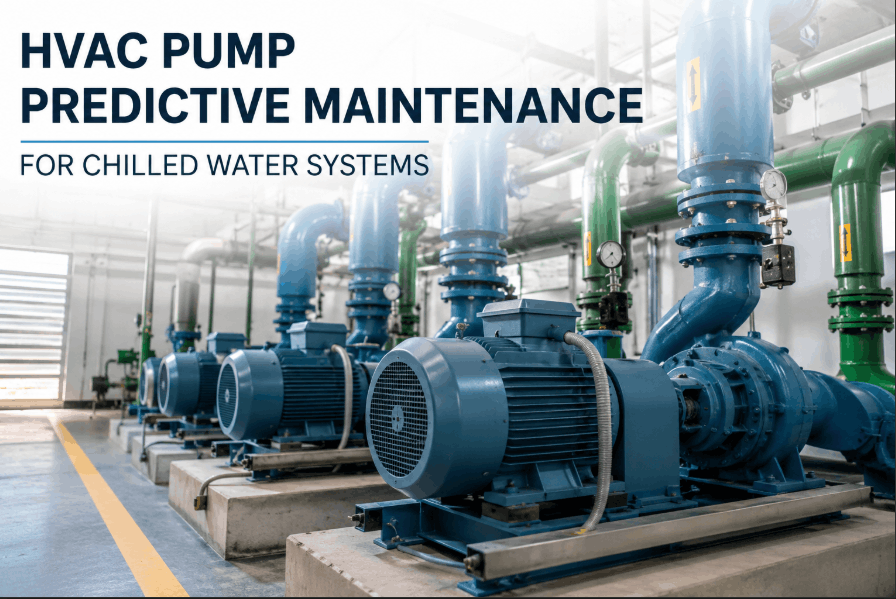
A single curve reading is a diagnosis; a trend is a prediction. Logged over time, the operating point and power draw reveal wear and fouling long before failure — which turns pump care from reactive to predictive. OXMAINT AI is the AI-powered maintenance platform that holds that trend and acts on it. Put your pumps on it when you start free and trend pump performance in OXMAINT AI.
Pump Register & Curve
Each pump with its design point, BEP and manufacturer curve on file for comparison.
Reading Log
Head, flow and power captured on every test, building the history that makes a trend.
Operating-Point Trend
The point tracked over time, so drift toward runout, low flow or wear shows up early.
Deviation → Work Order
A reading off the expected point raises a prioritised repair with the data attached.
Scheduled Testing
Recurring performance tests generated on cadence so the trend never goes dark.
Energy Insight
Power trended against flow so a pump creeping away from efficiency is caught and corrected.
The Curve Shows What the Gauges Alone Can't.
A pressure reading is a number; the operating point on the curve is a diagnosis. Trend it, and a worn impeller or a fouling system announces itself weeks ahead. OXMAINT AI makes the test repeatable and the drift visible.
Written for HVAC, hydronic and facilities engineering teams. Pump curve analysis is a standard performance-testing method for centrifugal pumps — the pump curve, system curve, best efficiency point, NPSH and the affinity laws are established hydraulic engineering. Actual acceptable operating ranges, NPSH margins and test methods depend on the specific pump, fluid, and system, and on the manufacturer's published curve for that model and impeller trim — use the maker's data and confirm readings with calibrated instruments. The diagram here is a schematic for explanation, not a reading from any specific pump. OXMAINT AI is a maintenance management platform that logs readings, trends the operating point and tracks the work — it is not a flow meter, a pump analyzer, or a substitute for a qualified engineer's diagnosis.
Frequently Asked Questions
What is a pump curve and why does it matter?
It's the manufacturer's plot of how much head (pressure) a pump produces at each flow rate — head falls as flow rises. It matters because the pump doesn't choose where it runs; the system does, at the point where the pump curve and the system's resistance curve cross. Knowing that point tells you whether the pump is efficient, strained or failing. Start free and store each pump's curve in OXMAINT AI.
What is the best efficiency point (BEP)?
The flow at which the pump converts the most input power into useful work — its happiest operating point. Running well to the left or right of BEP lowers efficiency and raises mechanical stress, vibration, recirculation and wear. The aim of good hydronic design and balancing is to keep the operating point near BEP.
How do I find where my pump is operating?
Read the suction and discharge pressures, convert the difference to total dynamic head, measure the flow, and plot that head-and-flow pair on the manufacturer's curve. Cross-check with the motor's power draw. Where the point lands — left, right, on or below the curve — is the diagnosis.
What causes a pump to operate below its curve?
If the pump can't make the head the curve promises at a given flow, the pump itself is usually the problem — a worn impeller or wear rings leaking internally, air binding, the wrong running speed, or reversed rotation. It's distinct from a system problem, which moves the point along the curve rather than dropping it below.
How does this become predictive maintenance?
By trending the operating point and power over time instead of reading them once. Gradual wear, fouling or a developing system fault shifts the point and the power draw slowly, and the trend reveals it well before a failure — so the repair is planned, not an emergency. Book a demo of pump performance trending in OXMAINT AI.
Plot the Point, Predict the Failure.
Run pump performance on OXMAINT AI: every pump with its curve and design point on file, head-flow-power readings logged on each test, the operating point trended against the curve, and a work order raised the moment it drifts — so a worn or struggling pump is caught on a trend line, not on the plant-room floor.