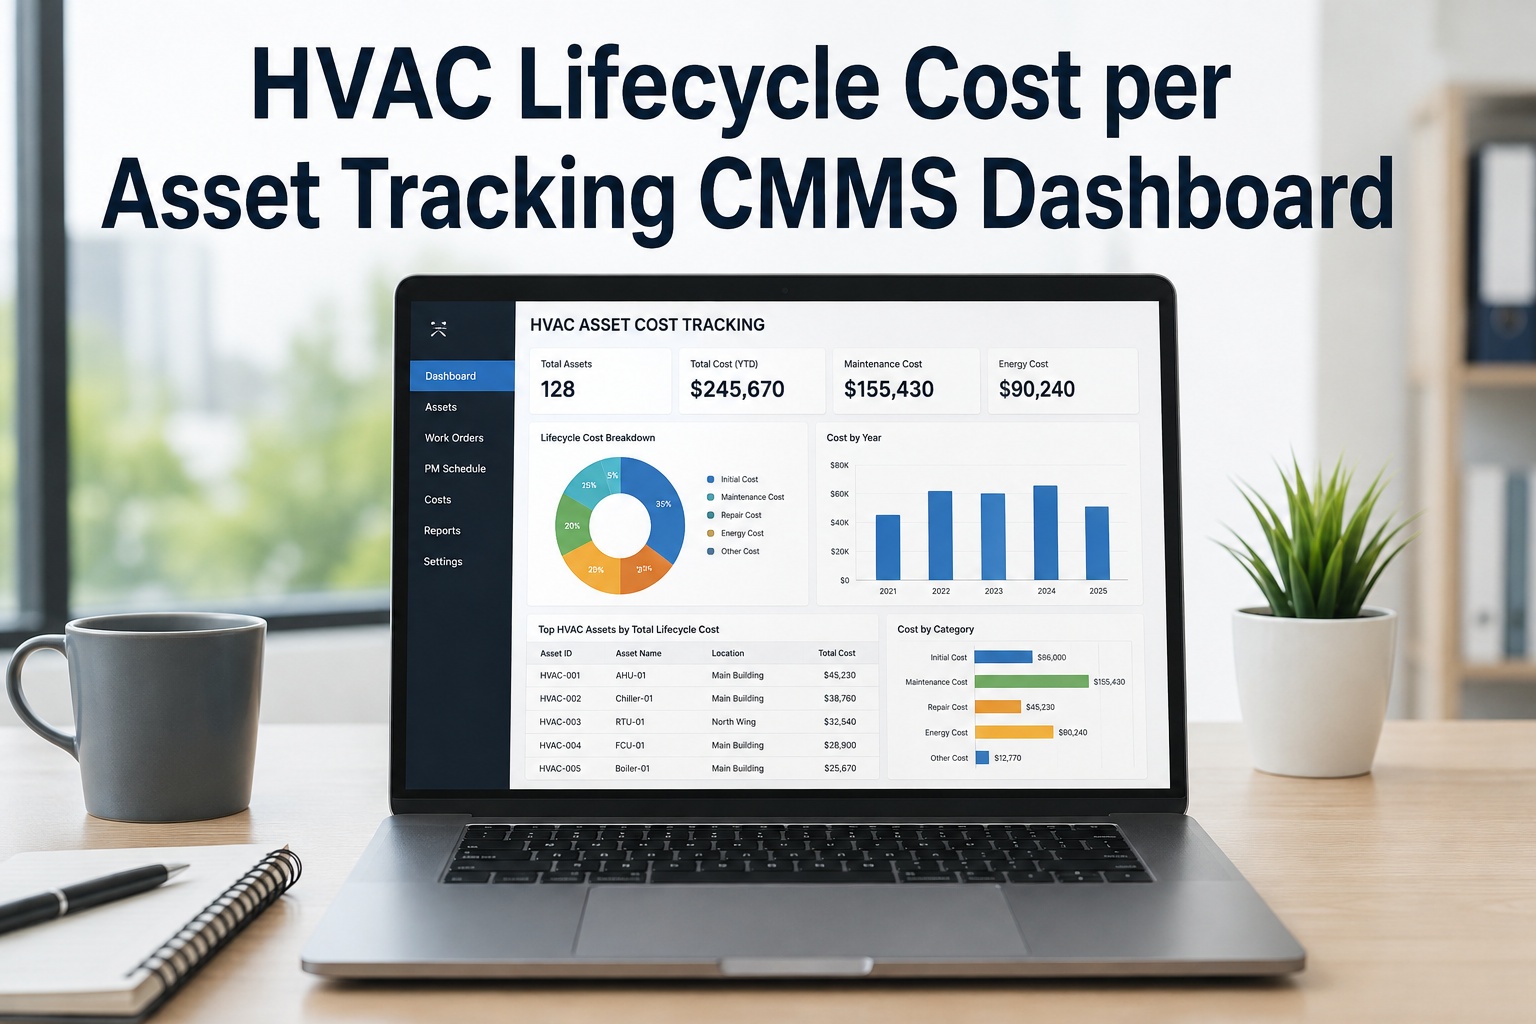
Fan array selection decisions in central plants are rarely made with a complete picture of ownership cost — capital cost wins the approval, while maintenance access requirements, redundancy constraints, and electrical efficiency differences determine what that decision actually costs over a 15-year asset life. Sign Up Free to log fan array inspection records, track energy performance readings, and link maintenance history to each plant asset in OxMaint so lifecycle cost comparisons are grounded in your actual operating data, not vendor projections. Upgrade decisions made with CMMS-backed asset history are measurably more accurate than those made from specification sheets alone.
Facility Engineering · Blog · Central Plant & HVAC
Fan Array Lifecycle Cost Comparison for Central Plants
Maintenance access, redundancy strategy, electrical efficiency, and CMMS-linked asset history — a practical lifecycle cost framework for fan array selection and central plant upgrade decisions.
73%Of central plant fan array replacements are driven by maintenance cost, not end-of-life failure
18%Typical energy efficiency gap between lowest and highest lifecycle cost fan array configurations
−38%Reduction in unplanned fan downtime when maintenance access is tracked per array configuration
3.2×ROI improvement when upgrade decisions are backed by CMMS asset history instead of vendor quotes
Fan Array Lifecycle Cost Components — What Every Comparison Must Include
A defensible lifecycle cost comparison covers more than purchase price and motor efficiency ratings — it accounts for the maintenance labour, redundancy overhead, and energy penalty each configuration carries over its operating life. Book a Demo to see how OxMaint structures fan array asset records to support capital planning decisions with real maintenance cost data.
Factor 1
Capital Cost Baseline
Unit cost, installation, controls integration, and commissioning — total installed cost as the starting point for comparison, not the equipment quote alone.
Foundation
Factor 2
Electrical Efficiency Rating
Fan total efficiency at design, part load, and peak conditions — annualised against actual plant operating hours for true energy cost comparison.
Core Metric
Factor 3
Maintenance Access Assessment
Labour time per PM task, bearing and belt replacement intervals, and access constraint multipliers factored in per configuration at actual technician rates.
Diagnostic
Factor 4
Redundancy Overhead
Spare unit requirements, N+1 capacity provisioning, and switchover test frequency costed across the asset life for each array configuration option.
Critical Gate
Factor 5
Failure Mode Cost History
CMMS work order records used to calculate average corrective maintenance cost per fan unit, normalised across operating hours for fair comparison.
Action
Factor 6
End-of-Life Replacement Cost
Projected replacement cost at end of service life, including disposal, installation downtime, and controls re-commissioning, discounted to present value.
Closure
The Lifecycle Cost Gap — How a Low Capital Cost Fan Array Becomes the Expensive Choice
The lowest-cost fan array at the point of approval is frequently not the lowest-cost asset over its operating life. Sign Up Free to track energy performance and maintenance cost per fan array asset in OxMaint, so the next upgrade decision starts from evidence, not from the vendor comparison sheet.
Fan Array Lifecycle Cost Gap — 5 Stages from Low Capital Cost to High Operating Cost
Stage 1
Lowest Bid Approved
Fan array selected on capital cost. Maintenance access constraints and part-load efficiency ratings not included in the evaluation.
$0
Cost if lifecycle model applied
↓
Stage 2
Maintenance Labour Penalty Emerges
Bearing access requires partial disassembly on each unit. PM task takes 2.5× longer than the competing configuration. Cost accumulates invisibly per visit.
$4,800
Annual labour premium, untracked
↓
Stage 3
Part-Load Efficiency Gap Compounds
Array runs at 55–65% load for most of the year. Efficiency at part-load is 14% lower than the higher-capital alternative. Energy cost gap widens annually.
$9,200
Cumulative energy premium, 3 yrs
↓
Stage 4
Redundancy Gap Causes Downtime
Unit failure with no hot standby. Central plant output reduced during repair. Corrective labour and downtime cost absorbed without a root-cause record.
$14,500
Downtime and emergency repair
↓
Stage 5
Early Replacement Required
Array reaches end of useful life at year 11 instead of 18. Full replacement approved without a lifecycle cost model to inform the next decision either.
$38,000+
Early replacement and re-commission
Lifecycle Cost Maturity Score — How Rigorous Is Your Fan Array Capital Planning?
Use the scoring framework below to assess your current fan array lifecycle cost evaluation process.
Fan Array Lifecycle Cost Maturity Score
Score 5 = full lifecycle model · Score 1 = capital cost only · Assess per plant upgrade decision
5
Fully Modelled — CMMS-Backed Lifecycle Comparison
Capital, energy, maintenance, redundancy, and replacement costs compared per configuration using actual CMMS asset history.
Action: Maintain asset performance tracking. Update lifecycle model at each PM cycle with actual cost data.
4
Mostly Modelled — Energy and Capital Only
Energy efficiency and capital cost compared. Maintenance access labour and redundancy overhead not included in the model.
Action: Add maintenance labour time per PM task to the comparison. Pull data from existing work orders.
3
Partially Modelled — Vendor Estimates Used
Lifecycle comparison attempted using vendor-supplied efficiency and maintenance interval data, without validation against plant conditions.
Action: Cross-reference vendor claims against CMMS records on comparable installed assets.
2
Reactive — Post-Purchase Cost Discovery
Lifecycle costs only understood after installation. Maintenance access and efficiency issues identified during first PM cycle.
Action: Begin logging maintenance time per fan array unit. Build cost baseline for the next upgrade.
1
Capital Cost Only — Active Planning Risk
Fan array decisions made on purchase price alone. No maintenance cost, energy efficiency, or redundancy data included.
Action: Build a fan array asset register in CMMS immediately. Start logging PM labour time this month.
Technology Integration: CMMS Asset History and Capital Planning Data
Accurate fan array lifecycle cost comparisons require maintenance records linked to each asset — not a spreadsheet rebuilt from memory before each budget cycle. Book a Demo to see how OxMaint connects fan array PM records, energy readings, and corrective work order costs into a capital planning dataset your engineering team can actually use.
Asset-Linked Cost History
100%
Full maintenance and energy cost visible per fan array unit
Every PM labour record, corrective work order, and energy reading logged against the specific fan array asset for lifecycle comparison.
PM Interval Tracking
−38%
Reduction in unplanned fan downtime with scheduled access tracking
Maintenance access requirements and bearing replacement intervals tracked per configuration to flag overdue tasks before failure.
Capital Planning Reports
3.2×
ROI improvement on upgrade decisions with CMMS-backed data
Asset cost history exported per unit type, giving engineering teams a real operating cost baseline for the next upgrade approval.
Mobile Field Logging
Offline
PM records logged from the plant room without connectivity
Technicians log fan array inspection results on mobile; data queues offline and syncs automatically on reconnection.
"
We were about to approve the lower-capital fan array configuration for our AHU replacement programme. When we pulled three years of PM labour records from OxMaint, the maintenance access penalty on the same model was adding $6,000 a year per unit we hadn't accounted for. The decision reversed immediately.
Chief Engineer — Commercial central plant facility
Root Causes of Inaccurate Fan Array Lifecycle Cost Comparisons
Fan array lifecycle cost errors in central plant capital planning cluster into six recurring root causes. Sign Up Free to address them with structured asset cost tracking in OxMaint.
Fan Array Lifecycle Cost Comparison Errors — Root Cause Distribution (%)
Maintenance labour not included in comparison
74%
Part-load efficiency not assessed at actual operating hours
66%
No CMMS cost history available for comparison
59%
Redundancy overhead not costed per configuration
51%
Vendor efficiency claims used without field validation
44%
End-of-life replacement cost excluded from model
37%
Make Your Next Fan Array Upgrade Decision with Real Cost Data.
OxMaint logs PM labour, energy readings, and corrective work order costs per fan array asset — giving your capital planning team the lifecycle data that vendor quotes don't include.
Frequently Asked Questions
What should a fan array lifecycle cost comparison include?
Capital cost, annualised energy at actual operating hours, PM labour per maintenance interval, redundancy overhead, and end-of-life replacement cost discounted to present value.
How does maintenance access affect fan array lifecycle cost?
Poor access design can double PM labour time per visit — a cost that accumulates across every scheduled inspection over the asset's full operating life.
How can a CMMS improve fan array capital planning?
A CMMS provides actual PM labour records, corrective cost history, and energy readings per asset — replacing vendor estimates with verified operating data for each configuration.
What is the typical useful life of a central plant fan array?
Well-maintained fan arrays in central plant environments typically achieve 15–20 years of service life; poor maintenance access and deferred PM can reduce this to under 12 years.
Can OxMaint track fan array energy performance alongside maintenance records?
Yes — energy readings and maintenance records are logged against the same asset, giving engineering teams a combined cost picture for each fan array unit in the plant.
Start Tracking Fan Array Lifecycle Cost in OxMaint Today.
Log PM labour, energy readings, and corrective costs per asset — build the capital planning dataset your next central plant upgrade decision needs, free to start.