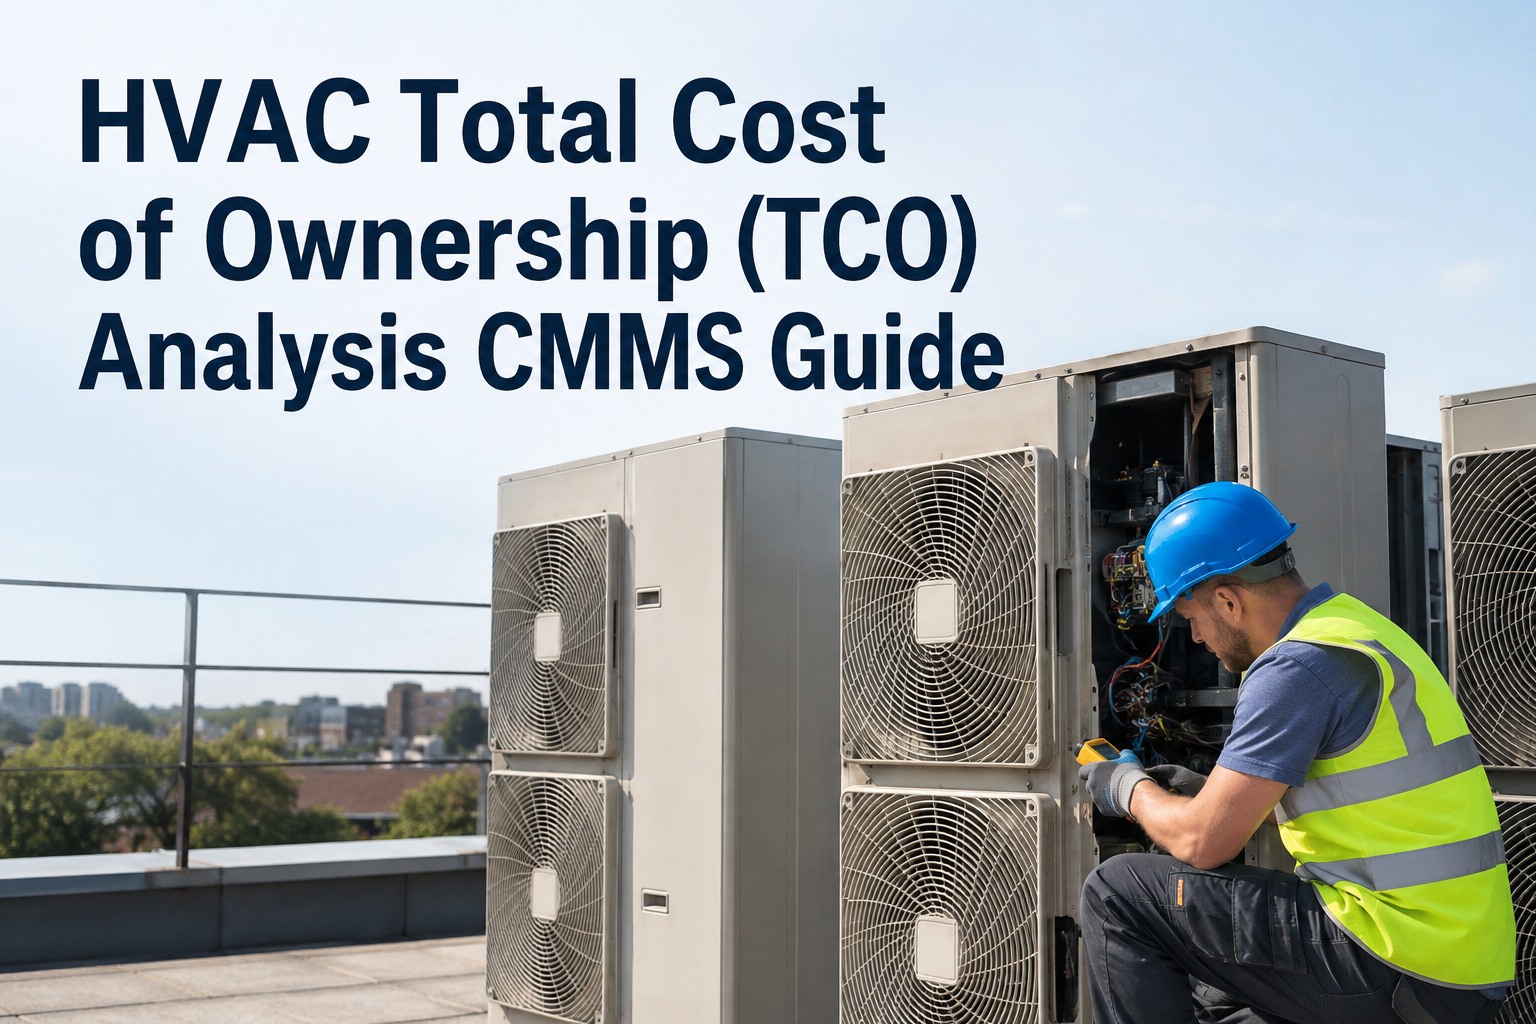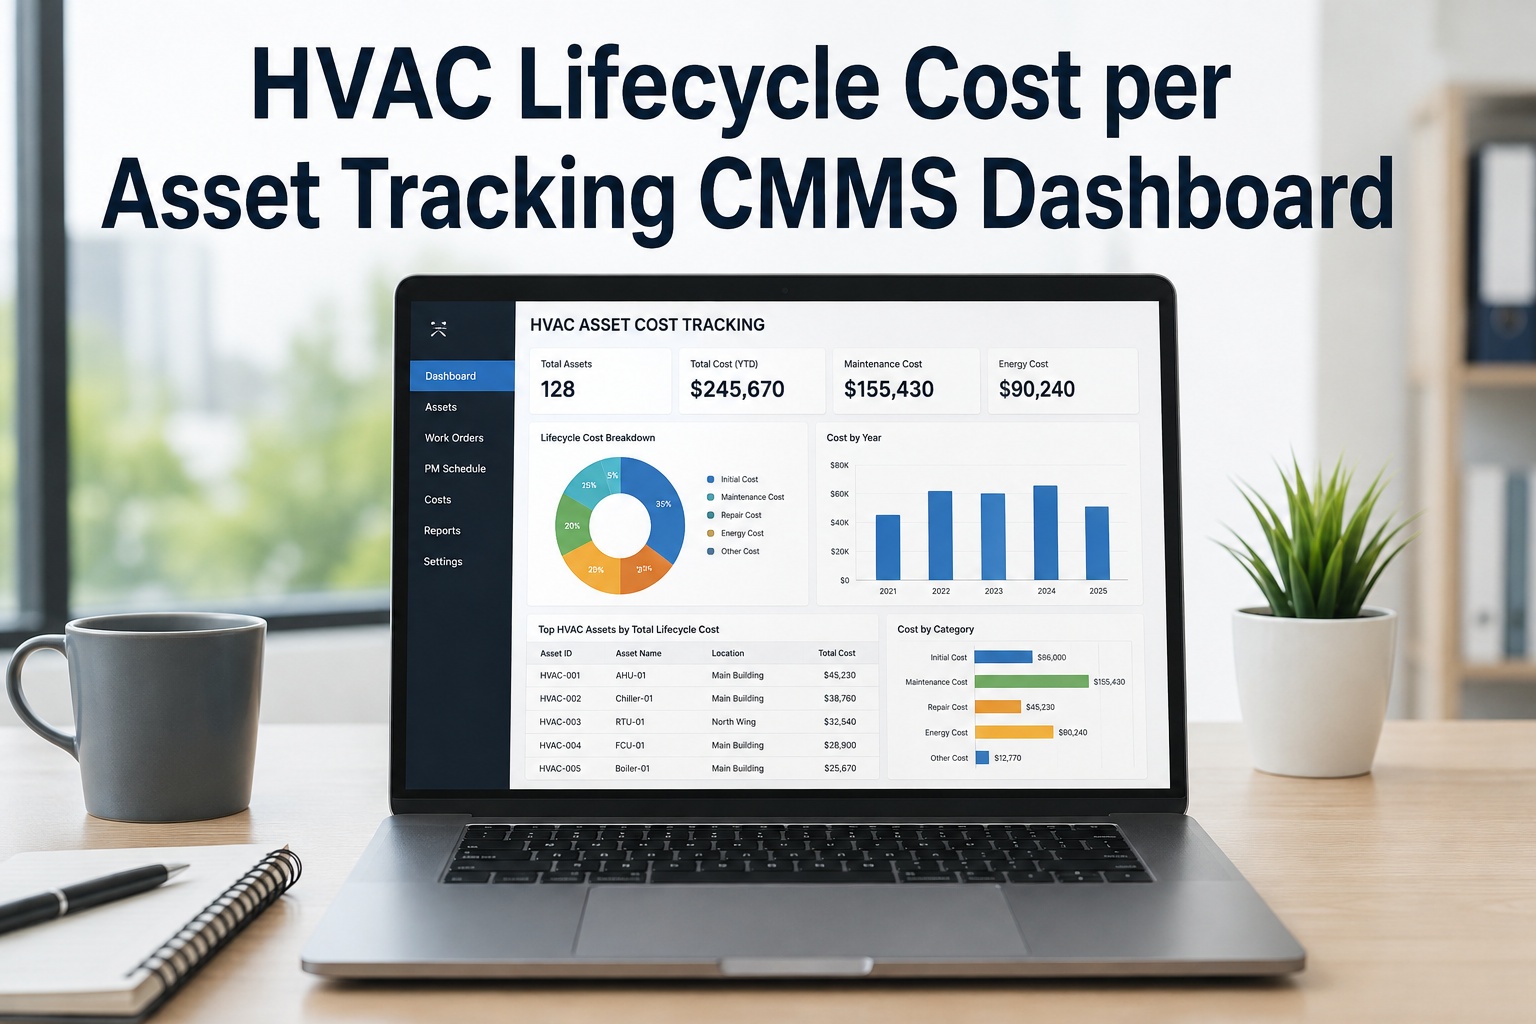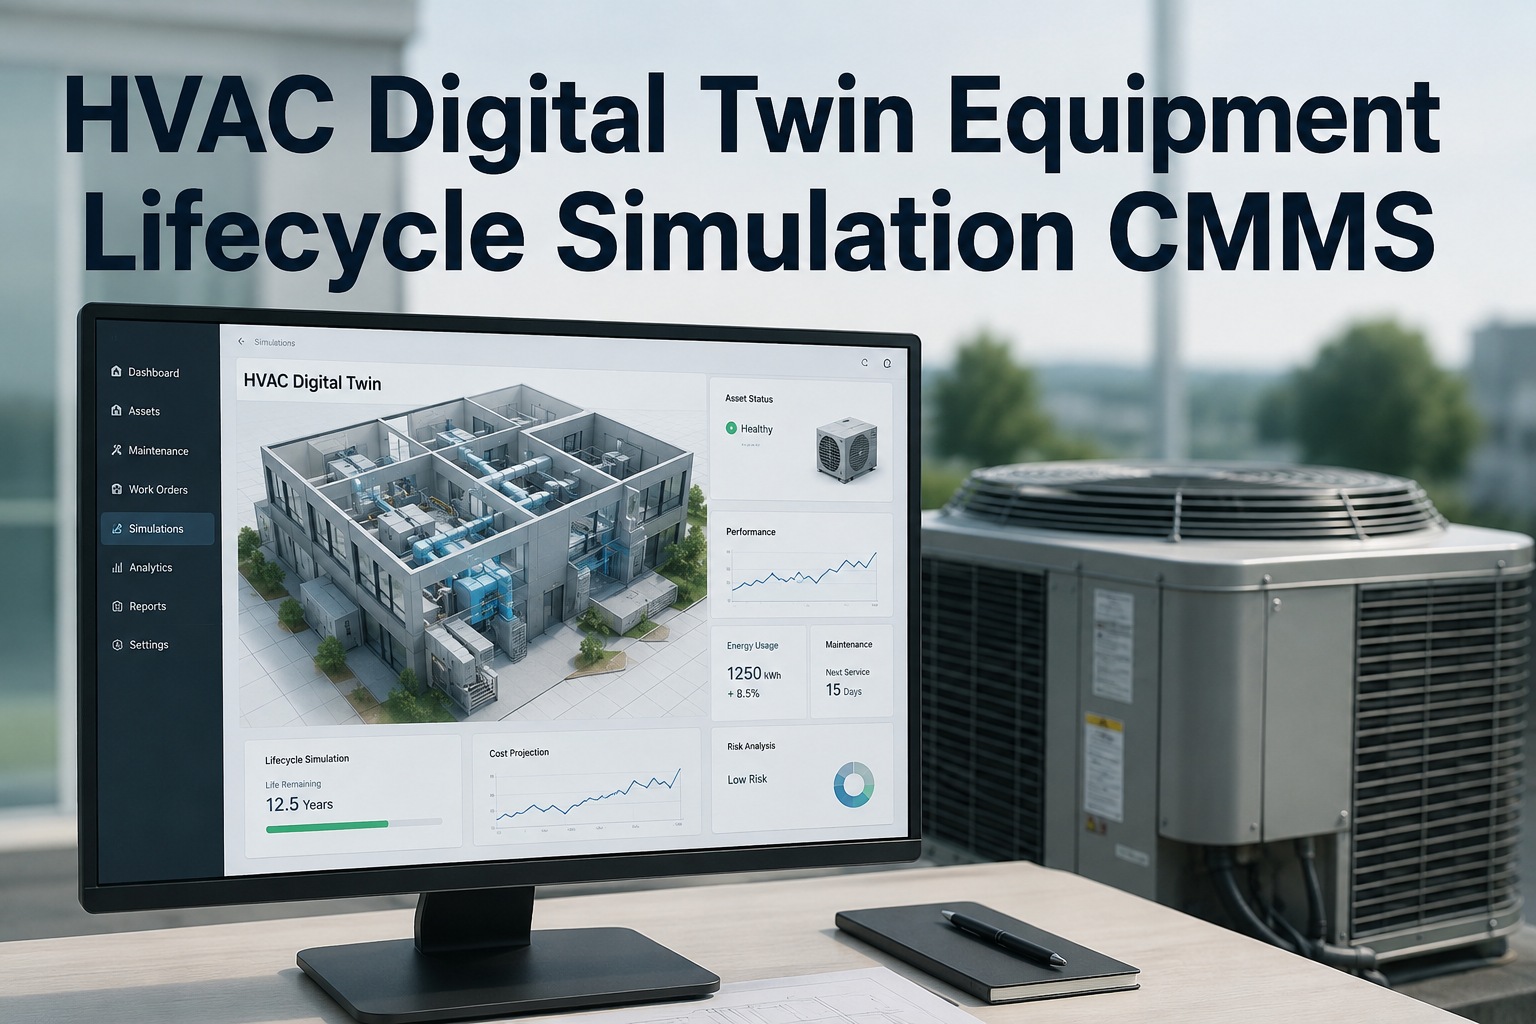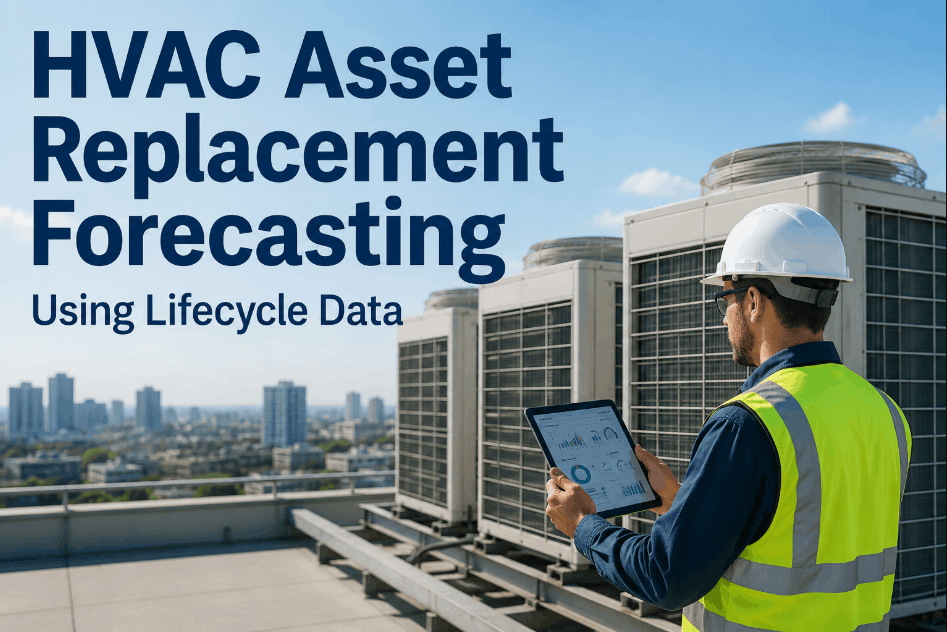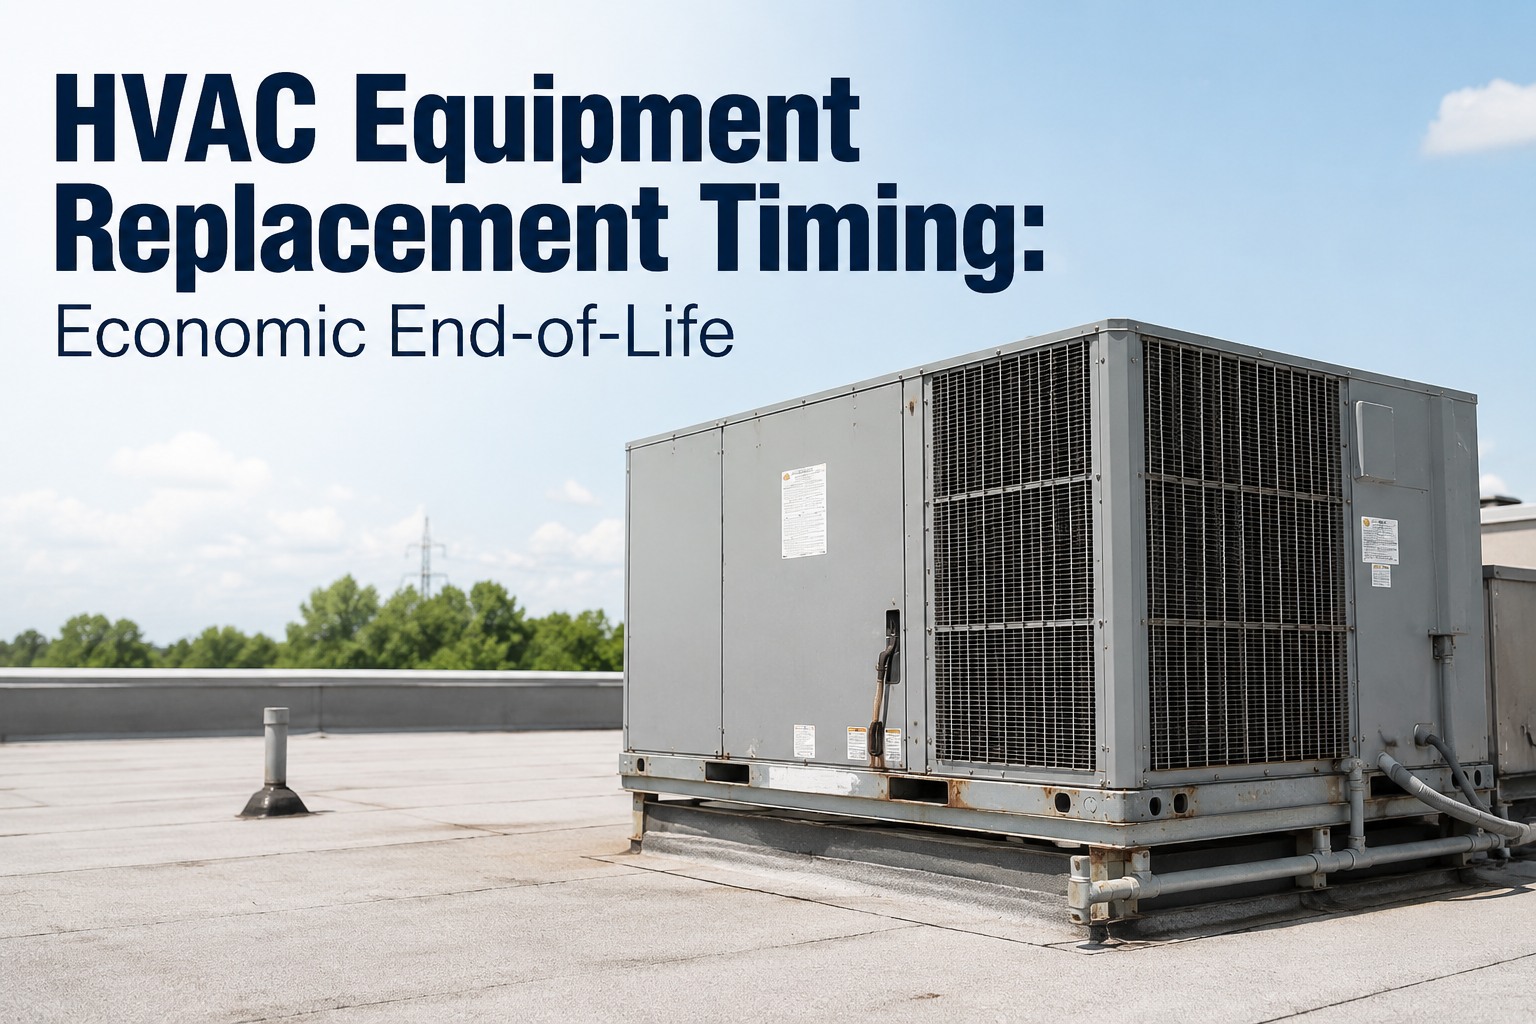
HVAC equipment replacement timing is the single most debated capital decision in facility maintenance — replace too early and you waste useful asset life; replace too late and you drown in reactive repairs, energy penalties, and downtime. The concept of economic end of life HVAC shifts the conversation from "How old is it?" to "What is the total cost of keeping it running?" — factoring rising repair spend, efficiency decay, reliability risk, and parts obsolescence. Equipment age HVAC cost curves typically inflect between years 12–15, where maintenance outlays can jump 60–80% compared to baseline. This HVAC replacement guide breaks down the financial signals, the CMMS-based replacement analytics that make the decision data-driven, and how teams use OxMaint to Start Free Trial and replace at the economically optimal moment rather than after a catastrophic failure.
When Does HVAC Reach Economic End of Life?
Most teams replace HVAC equipment reactively — after a catastrophic failure, an emergency repair invoice, or a comfort complaint from a tenant. By the time failure forces the decision, you have already overpaid by 30–50% in escalating repair costs, energy waste, and downtime. Economic end-of-life analysis flips that model: you replace at the lowest total-cost point, backed by CMMS data — not gut feel or a sticker date.
How Equipment Age Drives HVAC Cost — Year by Year
HVAC equipment does not fail on a schedule, but its cost curve is remarkably predictable. Compressors, condenser fans, heat exchangers, and controls degrade along a bathtub reliability pattern — high early-life infant mortality, a flat mid-life steady state, and a steep wear-out ramp. The HVAC replacement decision hinges on spotting where your asset sits on that ramp before the repair bills spike.
Lowest cost period. Manufacturer warranty covers major component failure. Maintenance is preventive — filters, belts, coil cleaning. Energy efficiency within 2% of nameplate. No replacement discussion needed.
Warranty expires. Wear parts (contactors, capacitors, bearings) begin cycling. Preventive maintenance frequency should increase 25–40%. Energy efficiency drops 5–10%. Track repair spend per asset in your CMMS — this is the baseline for end-of-life math.
Compressor overhauls, heat exchanger scaling, and controls board failures surface. Energy penalties hit 12–20%. Refrigerant phase-outs (R-410A, R-22) may force costly conversions. This is where economic replacement analysis should begin — not at failure.
Maintenance costs are 60–80% higher than baseline. Mean time between failures drops below 90 days. Spare parts lead times stretch to 4–8 weeks. Energy consumption is 20–35% above original spec. Every additional service year erodes capital budget faster than replacement financing.
The Economic End-of-Life Formula for HVAC
The ISO 55000 framework defines economic obsolescence as the point where the marginal cost of retaining an asset exceeds the amortized cost of replacement. Translated to HVAC, that means comparing annual rising O&M cost against the leveled annual cost of a new, higher-efficiency unit. When the two lines cross, replacement is economically justified — regardless of whether the equipment still "works."
Sum of all labor, parts, and contractor invoices tied to the asset over the trailing 12 months. Pull directly from CMMS work-order history. Include refrigerant top-offs — frequent recharges indicate leak progression, not a one-off repair.
Efficiency decay from fouled coils, degraded insulation, and compressor wear. Compare current kW/ton against nameplate using BAS trend data. A 20-ton chiller losing 15% efficiency costs roughly $1,800–$2,400 per year in extra electricity at $0.12/kWh.
The business impact of an unplanned outage — lost production, tenant credits, spoiled inventory, SLA penalties. Estimate as: (probability of failure in next 12 months) × (cost per outage event). A 16-year-old RTU with quarterly failures carries far more risk than a repair bill alone suggests.
Real-World HVAC Replacement Decision: 180-Asset Facility
Consider a 180-asset commercial facility spending $42,000 per year on HVAC maintenance. Eight rooftop units are 16 years old. Their combined annual repair spend has climbed from $4,200 (year 10) to $11,800 (year 16). Energy penalties add another $6,400. Two units failed during peak summer, triggering $9,000 in tenant SLA credits. Here is how the economic end-of-life math plays out:
| Cost Component (8 RTUs, Year 16) | Annual Amount | Trend (vs. Year 10) | Decision Signal |
|---|---|---|---|
| Repair labor & parts | $11,800 | +181% | Strong replace signal |
| Energy penalty (efficiency loss) | $6,400 | +120% | Moderate replace signal |
| Tenant SLA credits (2 outages) | $9,000 | New cost | Critical replace signal |
| Emergency contractor premium | $3,200 | +95% | Strong replace signal |
| Total annual cost of retaining | $30,400 | — | Exceeds replacement amortization ($24K/yr) |
Retaining the 8 RTUs costs $30,400/year and rising. Replacement amortized over 15 years at 7% APR costs $24,000/year — including $4,200 in energy savings from higher SEER2 ratings. Replacing now saves $6,400 in year one, with savings compounding annually as old-unit repair costs continue to escalate. Waiting even one more year adds an estimated $3,800 in additional repair and energy spend.
CMMS Replacement Decision Analytics with OxMaint
Most facilities track HVAC age in a spreadsheet and repair costs in a filing cabinet — if at all. OxMaint unifies asset history, work-order spend, energy metering, and failure patterns in one AI-powered platform, so the economic end-of-life calculation runs automatically. You see exactly which assets are crossing the replacement threshold, ranked by financial urgency, before failure forces a panicked capital request.
Every work order, part, labor hour, and contractor invoice is automatically tied to the asset record. OxMaint calculates rolling 12-month repair cost per unit and flags any asset exceeding your economic threshold — no manual spreadsheet rollups.
AI models analyze vibration, temperature, run-hours, and work-order frequency to predict component failure probability. MTBF trending, failure mode analysis, and condition-based triggers replace calendar-based guessing with quantified risk scores.
Auto-generated reports compare retaining vs. replacing each asset: projected repair escalation, energy savings from new equipment, financing amortization, and payback period. Export ready for capital budget committees with one click.
OxMaint tracks parts availability and lead times for each asset model. When manufacturer support ends or critical spares move to long-lead-time status, the system flags the asset for replacement evaluation — before a 6-week parts wait turns into a tenant exodus.
Step-by-Step Replacement Timing Guide for 2026
SEER2 efficiency standards, refrigerant transitions (R-410A phase-down under AIM Act), and rising electricity rates are reshaping the HVAC replacement economics in 2026. Here is a month-by-month timeline for executing a data-driven replacement program using CMMS analytics.
Export all HVAC work orders from OxMaint (or import from your current system). Tag every asset with install date, model, capacity, and current condition score. Establish baseline repair cost per asset per year.
For each asset 10+ years old, calculate the four formula components: annual repair cost, energy penalty, downtime risk, and replacement amortization. Rank assets by total cost-of-retention. Flag any asset where retention cost exceeds replacement cost.
Group flagged assets into a phased replacement plan. Prioritize by combined financial urgency and operational criticality. Use OxMaint ROI dashboards to generate the business case — projected savings, payback period, risk avoided — for capital committee review.
Schedule replacements for spring or fall to minimize disruption and contractor premiums. Pre-order long-lead-time equipment. Coordinate decommissioning, installation, and commissioning through OxMaint work orders so the new asset's lifecycle tracking starts on day one.
Verify energy savings against projections using BAS meter data. Confirm repair spend drops to near-zero on replaced units. Re-run the end-of-life analysis quarterly on remaining assets — the cost curve is always moving, and next year's candidates are already forming.
See OxMaint Replacement Analytics on Your HVAC Assets
Book a 30-minute demo and we will load your asset list, pull 3 years of repair history, and show you exactly which units have crossed economic end of life — before they fail.
Frequently Asked Questions About HVAC Replacement Timing
Commercial HVAC equipment typically lasts 15–20 years for rooftop units and chillers, 20–25 years for boilers, and 10–15 years for split-system condensers — but lifespan is not the same as economic life. An RTU can physically run for 22 years while becoming economically obsolete at year 14 due to rising repair costs, efficiency decay, and parts availability. Economic end of life usually arrives 4–7 years before physical end of life, which is why age alone should never drive the replacement decision.
Use the economic replacement trigger: when annual repair cost plus energy penalty plus downtime risk cost equals or exceeds the amortized cost of replacement plus energy savings, the asset has reached economic end of life. A practical rule of thumb — if a single repair exceeds 50% of replacement cost on a unit older than 12 years, replace. For data-driven precision, a CMMS like OxMaint automates this calculation using your actual work-order and energy data, eliminating guesswork.
HVAC equipment aged 15+ years typically costs 60–80% more per year to maintain than the same equipment at 5–8 years old. This includes a 2–3× increase in repair frequency, 20–35% energy efficiency degradation, longer spare-parts lead times, and higher emergency contractor rates. For a 20-ton RTU, that can mean spending $4,000–$7,000 per year in additional cost versus a new unit — money that could be financing replacement instead.
Yes — a CMMS is the single most important tool for data-driven HVAC replacement decisions. It tracks every work order, part, labor hour, and failure event per asset over its full lifecycle, giving you the actual repair cost trend rather than an estimate. Advanced platforms like OxMaint add predictive failure analytics, energy penalty calculations, and automated replacement ROI dashboards that rank assets by financial urgency. You can see the full picture and book a personalized walkthrough at calendly.com/oxmaintapp/30min.
Two major regulatory shifts are accelerating HVAC replacement in 2026. First, the AIM Act mandates an 85% reduction in HFC refrigerant production (including R-410A) by 2026, driving up refrigerant prices and making older systems expensive to service. Second, SEER2 efficiency minimums raised the baseline for new equipment, meaning replacements now deliver 20–30% energy savings versus units installed 12+ years ago. Both factors shift the economic end-of-life curve earlier — assets that might have limped to year 18 are now candidates at year 14.
Stop Replacing HVAC Reactively. Start Deciding with Data.
OxMaint turns years of work-order history into a clear, ranked replacement plan — so you replace the right asset at the right time, cut unplanned downtime 30–50%, and stop overpaying to keep dying equipment alive.
Free 14-day trial · No credit card