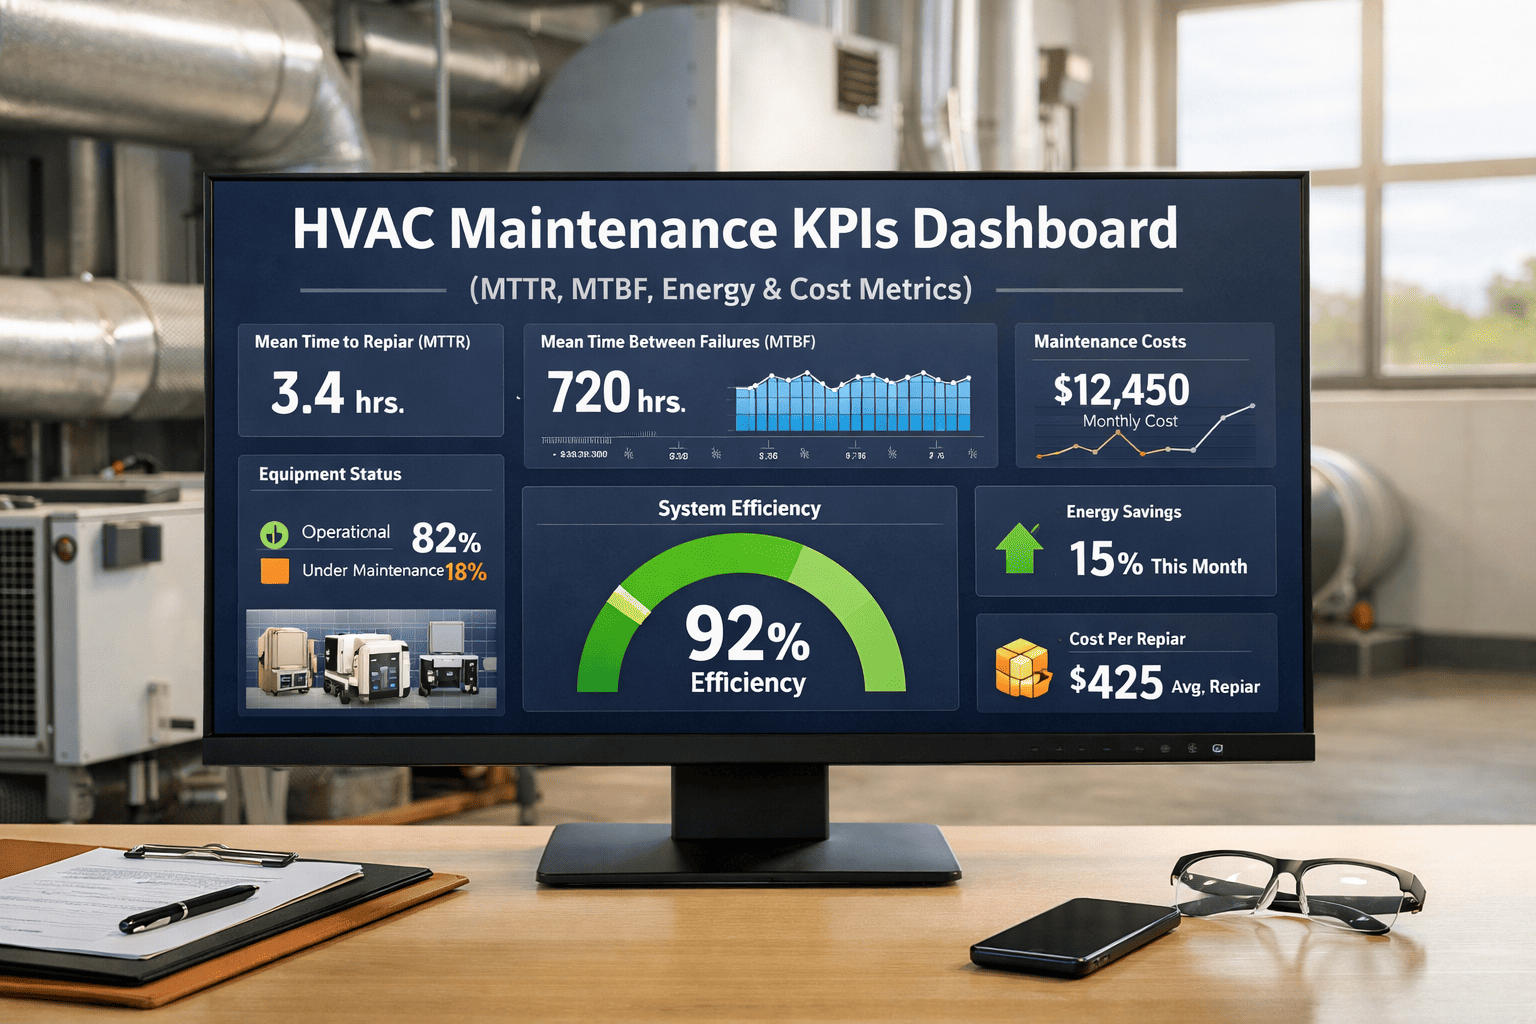
Most facility managers know their HVAC program is underperforming — they just cannot prove it in numbers that drive action. PM compliance sits at 85% on paper while energy costs keep rising. Reactive work orders consume 40% of technician time while the schedule looks fine. The gap between perceived and actual performance exists because most teams track the wrong metrics or track nothing at all. OxMaint's Analytics and Reporting platform auto-calculates every KPI below from your team's normal workflow — no separate data entry, no manual reports.
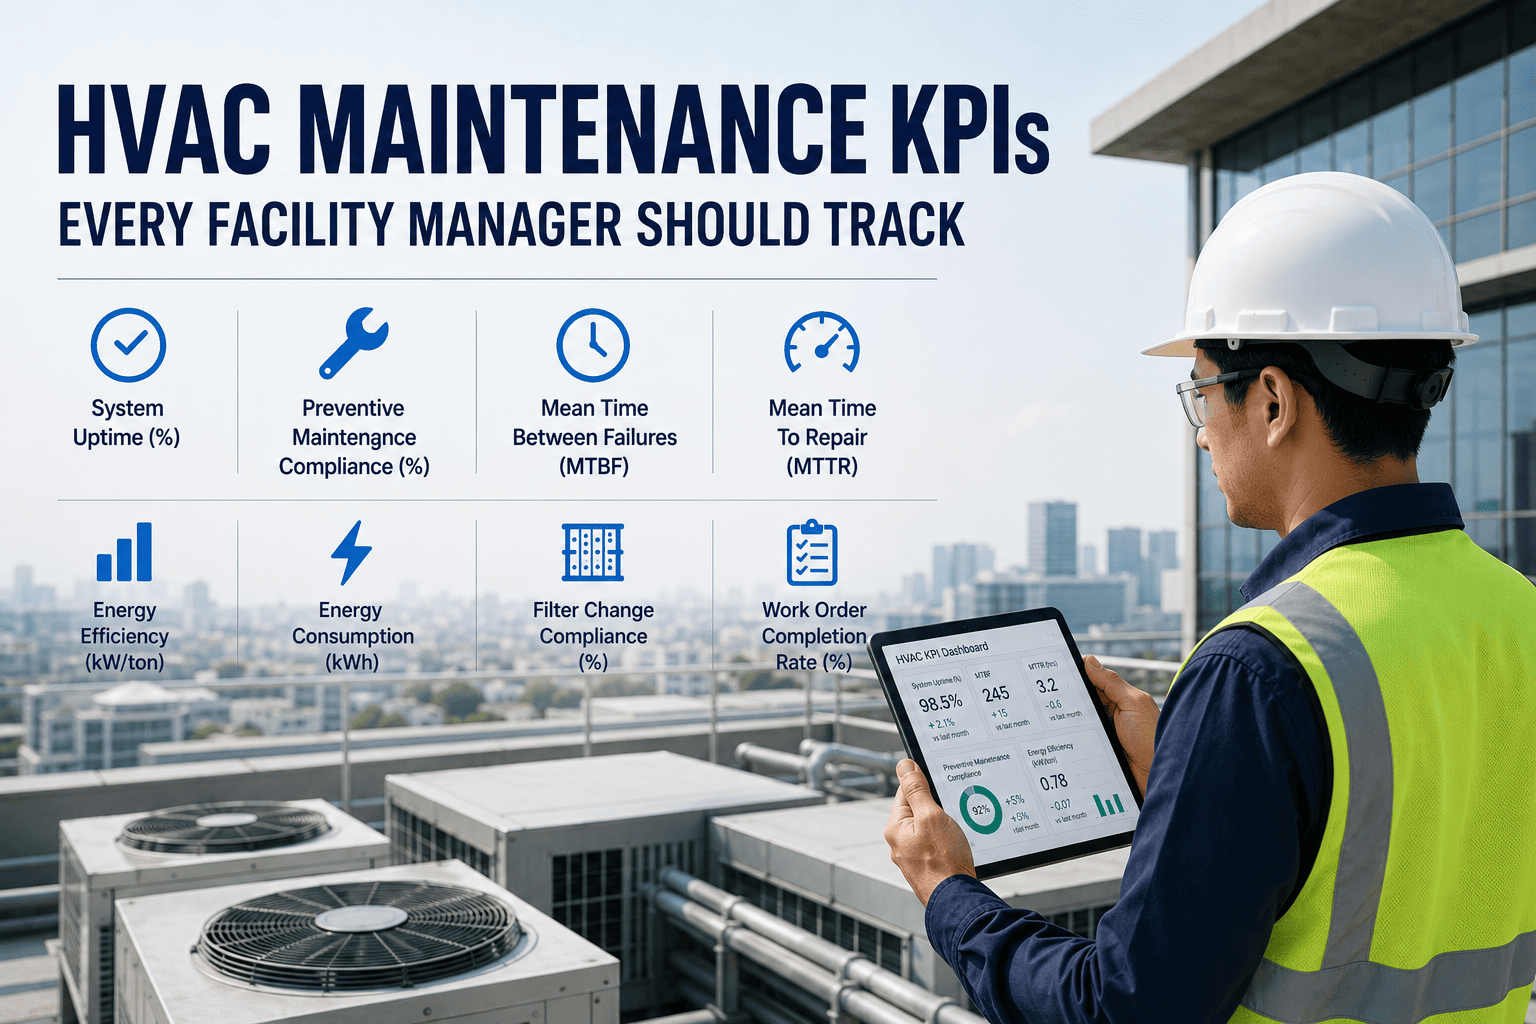
The 8 HVAC KPIs Every Facility Manager Must Track
These are leading and lagging indicators that together reveal whether your HVAC maintenance program is running proactively or reactively — and where to intervene first.
Full KPI Benchmark Reference Table
| KPI | Industry Average | World-Class Target | Type | Improvement Impact |
|---|---|---|---|---|
| PM Compliance | 55–70% | 85–95% | Leading | 40–50% lower total maintenance cost |
| MTTR | 3–6 hours | 60–90 minutes | Lagging | 60% fewer tenant complaints |
| Reactive Work Ratio | 30–45% | < 20% | Leading | 3–5x cost reduction per repair event |
| First-Time Fix Rate | 60–70% | 85%+ | Lagging | 30–40% lower labor cost per repair |
| Energy Deviation | 30%+ undetected | Within 5% baseline | Leading | 5–20% annual energy savings |
| MTBF Improvement | Baseline varies | +90–175 hrs (CBM) | Lagging | Fewer surprise failures, lower reactive spend |
| Comfort Complaint Rate | > 0.8 / 1K sqft | < 0.2 / 1K sqft | Leading | Improved tenant retention, lease value |
| Backlog Age | 12–18 days avg | < 7 days | Lagging | Early warning of staffing and parts gaps |
Track All 8 KPIs in One Live Dashboard
OxMaint auto-calculates every KPI above from your team's normal workflow — no spreadsheets, no manual reports. Book a demo to see your facility's KPIs live on day one.
Which KPIs to Fix First — The Priority Sequence
Not all KPIs move independently. This sequence shows the causal chain — fix the upstream metric and the downstream ones follow automatically.
Expert Review
The facilities that struggle most with HVAC performance are not the ones with the worst technicians — they are the ones tracking the wrong metrics at the wrong frequency. PM completion rate reported monthly is a lagging indicator that tells you what happened six weeks ago. What drives improvement is weekly visibility into leading indicators: reactive work ratio trending up, first-time fix rate declining, backlog age crossing 10 days. When these leading signals move, MTTR and energy cost follow within one to two quarters. A live analytics dashboard that surfaces these trends automatically — without requiring a manager to compile a spreadsheet — is the practical difference between a reactive program that reports its failures and a proactive program that prevents them.
Stop Discovering Problems After They Happen
OxMaint's analytics dashboard surfaces every leading KPI in real time — so you see the reactive spike building 6 weeks before it arrives, not after your CFO asks why the maintenance budget is over.
Frequently Asked Questions
Which HVAC KPI should a facility manager prioritize first?
PM compliance rate is the highest-priority starting KPI for most facilities because it is the upstream cause of most downstream problems — rising reactive work, increasing MTTR, and growing energy deviation all trace back to declining PM completion. The industry average sits at 55–70%; facilities that reach 85% compliance consistently show 40–50% lower total maintenance costs within 12 months. OxMaint's analytics dashboard calculates PM compliance in real time from technician work order completions — no manual tracking required, and the trend line shows direction before the metric reaches a crisis point.
What is a good MTTR target for commercial HVAC systems?
World-class facilities achieve mean time to repair (MTTR) of 60–90 minutes for standard HVAC faults — from fault detection through technician dispatch to resolution and work order closure. The industry average is 3–6 hours. The gap is almost never about technician speed; it is about response workflow: how quickly the fault is detected, whether the right technician is dispatched with the right parts, and whether the asset history is available before the first wrench turn. Book a demo to see how OxMaint's work order automation reduces dispatch-to-resolution time by 60% through mobile task delivery and pre-loaded asset history.
How do leading and lagging HVAC KPIs differ in practice?
Leading indicators predict future performance — PM compliance rate, reactive work ratio, and comfort complaint rate all signal where performance is heading before it gets there. Lagging indicators measure outcomes that have already occurred — MTTR, first-time fix rate, and maintenance cost per square foot tell you what happened last month. Effective HVAC management requires both: leading indicators to identify trends early enough to act on, and lagging indicators to confirm whether those actions produced the expected results. The most common mistake is tracking only lagging indicators, which guarantees you are always managing last month's problems.
Can OxMaint track HVAC KPIs across multiple buildings in one dashboard?
Yes. OxMaint's portfolio analytics view displays all eight KPIs simultaneously across every building in a portfolio, ranked by performance so the highest-priority intervention sites are immediately visible. Directors can drill into any building for asset-level and technician-level detail with one click. Custom threshold alerts notify the right stakeholder the moment any KPI crosses a defined boundary — for example, when PM compliance at a specific site drops below 80%, the facility manager and director both receive an alert before the next reactive spike occurs. Most portfolio deployments are live within two weeks of implementation.