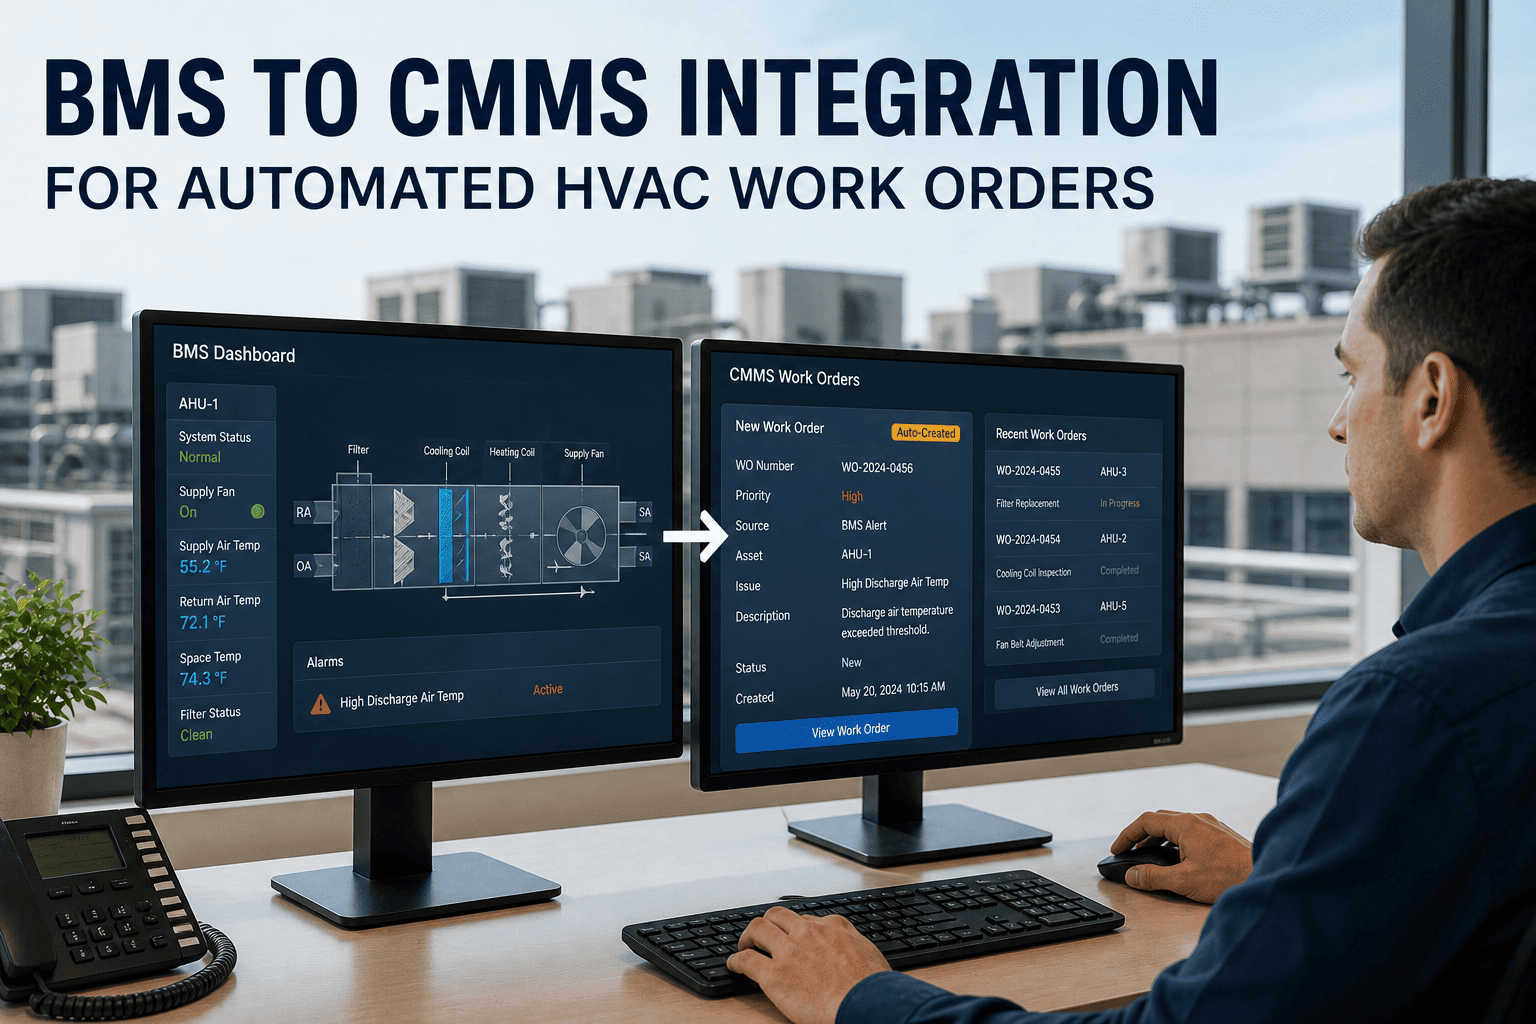
Most facility managers know their HVAC program is underperforming — they just cannot prove it in numbers that ownership will act on. Mean time to repair sitting at 4.2 hours when world-class is 90 minutes. PM compliance reported at 85% but energy costs still rising. Reactive work at 40% of all work orders while the maintenance team insists they are on schedule. The problem isn't the maintenance team — it's the absence of real-time data to manage it. OxMaint's Smart HVAC Maintenance Dashboard gives facility managers and directors a live, unified view of every KPI that drives HVAC performance — from asset health to technician productivity — so decisions are made on data, not instinct.
What a World-Class HVAC Dashboard Shows in Real Time
Six dashboard panels — each answering a question that previously required hours of spreadsheet work to answer at all.
The 8 KPIs Your HVAC Dashboard Must Track
World-class facility teams track leading indicators — the metrics that predict next month's performance — not just lagging indicators that report what already happened. These eight KPIs define the difference.
| KPI | What It Measures | Industry Average | World-Class Target | Impact of Improvement |
|---|---|---|---|---|
| MTTR | Average repair time from fault to resolution | 3–6 hours | 60–90 minutes | Reduces tenant complaints and emergency overtime |
| MTBF | Average run time between breakdowns | Baseline varies by asset | 90–175 hrs improvement with CBM | Fewer surprise failures, lower reactive spend |
| PM Compliance | Percentage of scheduled PMs completed on time | 55–70% | 85–95% | 40–50% lower total maintenance cost at 80%+ |
| Reactive Work Ratio | Unplanned repairs as % of all work orders | 30–45% | Below 20% | Reactive repairs cost 3–5x planned work |
| First-Time Fix Rate | Work orders resolved without a return visit | 60–70% | 85%+ | Reduces labor cost per repair by 30–40% |
| Cost per Sq Ft | Total HVAC maintenance spend ÷ conditioned area | $3.50–$5.50 (Class A) | 20–30% below peer benchmark | Direct budget efficiency proof for ownership |
| Energy Deviation | Actual vs. baseline energy by asset | 30%+ undetected waste (NIST) | Within 5% of baseline | 5–20% annual energy savings (U.S. DOE) |
| Work Order Backlog Age | Average days open for unresolved work orders | 12–18 days average | Below 7 days | Signals staffing, parts, or process bottlenecks early |
Replace Spreadsheets with a Live HVAC Dashboard
OxMaint auto-calculates every HVAC KPI from normal maintenance workflow — no separate data entry, no manual reports. Your team works, the dashboard updates in real time.
Dashboard Layers: What Each Stakeholder Needs to See
A single dashboard that shows everything to everyone creates noise, not clarity. OxMaint's role-based views filter the same underlying data to match what each stakeholder needs to act on.
Before vs. After: What Changes When Facility Teams Use a Live Dashboard
Expert Review
The facilities that struggle most with HVAC KPI improvement are not the ones with the worst maintenance teams — they are the ones tracking the wrong metrics. PM completion rate is a lagging indicator that tells you what happened last month. What drives improvement is leading indicators: technician wrench time trending upward, first-time fix rate approaching 85%, reactive work percentage declining as PM compliance rises. When these leading indicators move, MTTR and MTBF follow within one to two quarters. The value of a live analytics dashboard is not in the KPI display — it is in the AI insight layer that connects a declining MTBF on a specific chiller to the missed condenser service from eight weeks ago. That causal link is what turns data into a maintenance decision, and maintenance decisions into ROI that a CFO understands.
Multi-Site Dashboard: Managing HVAC Across a Portfolio
For directors overseeing multiple properties, the greatest value of a live dashboard is comparative visibility — seeing which buildings are performing, which are deteriorating, and why. OxMaint's portfolio view ranks every building on the same KPI set simultaneously.
| Building | PM Compliance | MTTR | Reactive Work % | Energy Deviation | Status |
|---|---|---|---|---|---|
| Tower A — HQ | 93% | 72 min | 16% | +2% baseline | On Track |
| Retail Center B | 74% | 3.8 hrs | 31% | +14% baseline | Review |
| Warehouse Complex C | 88% | 95 min | 21% | +5% baseline | On Track |
| Medical Office D | 61% | 5.2 hrs | 44% | +22% baseline | Action Required |
Your HVAC Data Is Already There — You Just Can't See It Yet
Every work order your team closes, every PM completed, every sensor alarm — that data exists but it's trapped in spreadsheets and disconnected systems. OxMaint surfaces it as live KPIs from day one, with no manual reporting required. Book a demo to see your facility's data visualized in OxMaint's dashboard.
Frequently Asked Questions
What HVAC KPIs should a facility manager prioritize on their dashboard first?
The highest-impact starting point for most facility managers is the reactive work ratio — the percentage of all work orders that are unplanned emergency repairs. This single metric reveals whether a maintenance program is running proactively or reactively, and reactive repairs consistently cost 3–5 times more per event than the same work performed as planned maintenance. The industry average sits at 30–45% reactive; world-class facilities operate below 20%. The second priority is PM compliance rate, because declining PM compliance is the leading cause of reactive work increase — the two metrics move together with a 6–12 week lag. OxMaint's analytics dashboard auto-calculates both from normal workflow data and displays trend lines — so a facility manager sees the reactive ratio climbing before the HVAC failures that will eventually result start occurring. Most facilities that begin tracking these two KPIs seriously see measurable improvement within 60–90 days.
How does OxMaint calculate HVAC KPIs without additional data entry from technicians?
OxMaint calculates HVAC KPIs automatically from the workflow data that technicians generate through normal task completion. When a technician creates a work order, that event timestamps the start of the response cycle. When they mark it complete on their mobile device, MTTR recalculates in real time. When a PM is closed, compliance percentage adjusts instantly. When parts are logged against a work order, cost-per-asset updates automatically. No separate KPI data entry process exists because the KPIs are derived directly from operational actions, not from reports about those actions. The only requirement is that technicians use OxMaint's mobile app to open and close work orders — a workflow that most teams adopt within the first two weeks of deployment because mobile completion is faster than the paper or email-based alternatives it replaces. IFMA benchmark comparisons are built into the dashboard and update automatically as your data accumulates.
What is a good PM compliance rate for commercial HVAC systems?
Industry benchmarks for PM compliance break into three performance tiers. Below 65% indicates reactive operations where emergency repairs dominate and the maintenance team is perpetually behind. Between 65% and 80% is a transitional zone — some PM structure exists but significant reactive volume persists. Above 80% is where the financial benefits become measurable: facilities at 80% or higher PM compliance consistently show 40–50% lower total maintenance costs per square foot compared to reactive programs. The IFMA benchmark for well-managed commercial facilities targets 85% or higher overall PM compliance, with critical systems — HVAC, fire suppression, and elevators — maintained at 95% or higher regardless of the building-wide average. OxMaint customers typically start at 31–45% compliance and reach 84% within 12 months, driven by automated PM scheduling and mobile completion workflows that eliminate the manual scheduling gaps that cause most compliance failures.
Can the OxMaint dashboard compare HVAC performance across multiple buildings?
Yes. OxMaint's portfolio dashboard is specifically designed for multi-site facility operations, displaying every KPI simultaneously across all buildings on a single screen. Directors can rank sites by PM compliance, MTTR, reactive work ratio, energy deviation, or cost per square foot — and drill into any property with one click for detailed asset and technician-level analysis. Custom threshold alerts notify the right person the moment a building's KPIs cross a defined boundary — for example, when PM compliance at a specific site drops below 80%, or when MTTR at a property exceeds 3 hours for three consecutive weeks. The portfolio view makes the highest-priority management action obvious without requiring a director to read through individual building reports — the outlier surfaces itself. This is particularly valuable for property management organizations overseeing 10, 20, or 50 buildings, where monitoring each site individually is impractical.