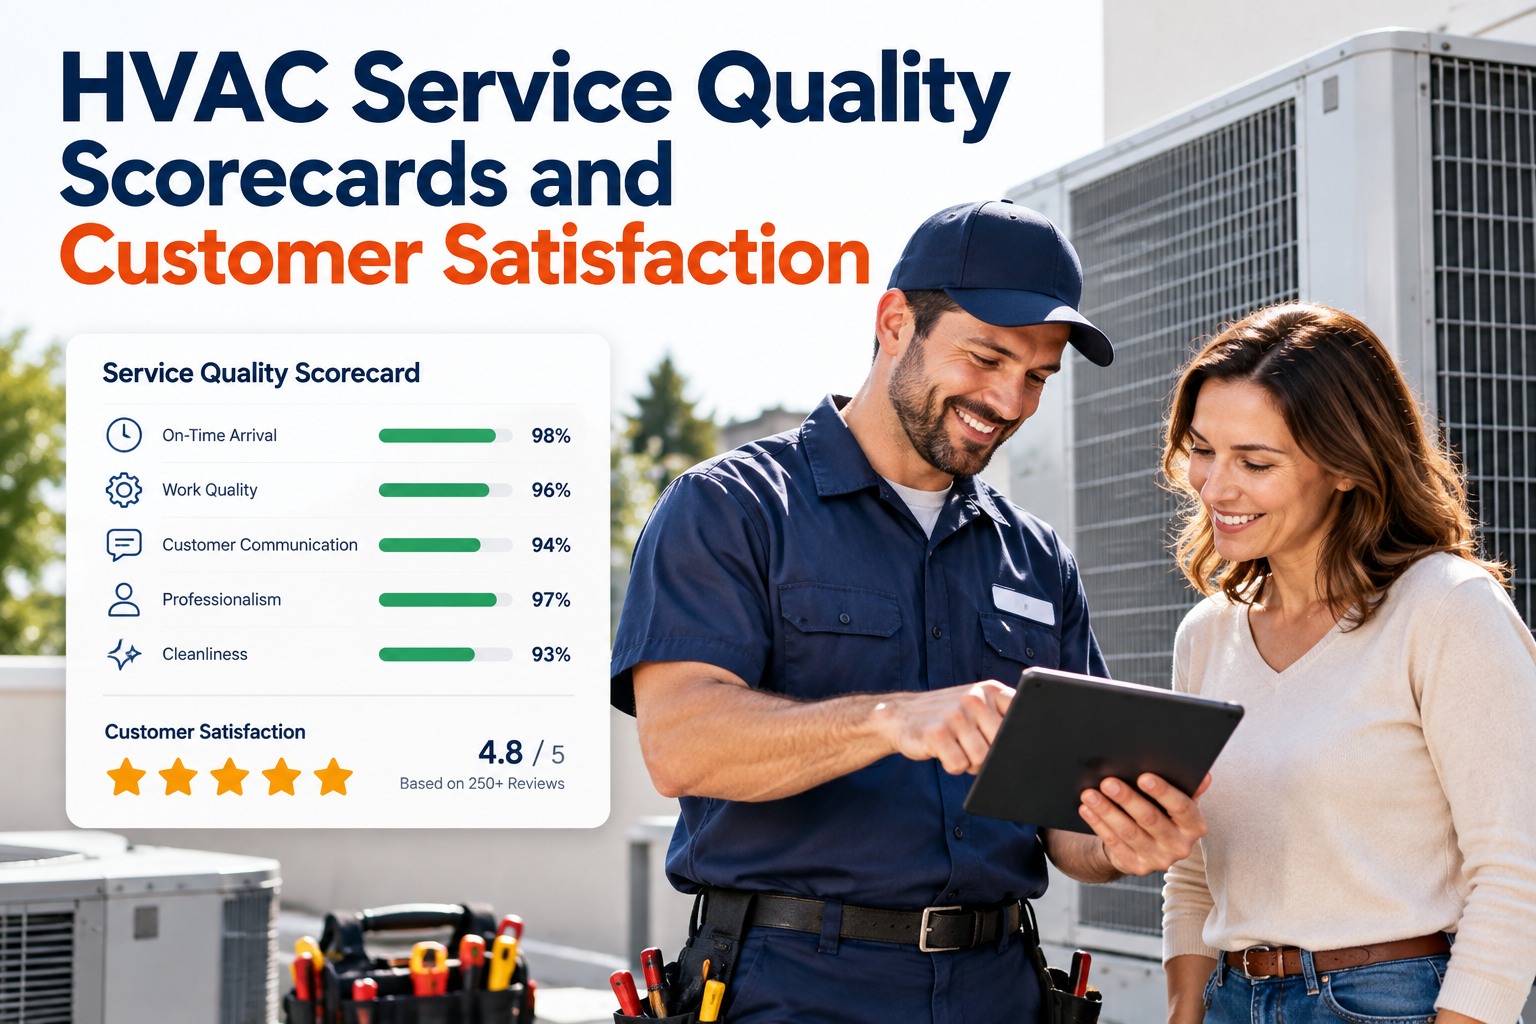
Every HVAC service team believes it does good work. Almost none can prove it with a number. So when the contract comes up for renewal and a competitor undercuts the price, the conversation is about dollars — because there's no evidence of value to point to instead. A service quality scorecard changes that conversation. It turns the work you're already doing into measured performance: first-time fix rate, response time, callback rate, customer satisfaction — tracked, trended, and presentable. Internally it shows which technicians and which behaviours to improve; externally it's the proof that keeps a client paying a premium. OxMaint AI maintenance management software captures most of those metrics straight from work orders, so the scorecard builds itself.
Turn the Work You Already Do Into the Number That Wins the Renewal
Quality you can't measure, you can't improve — and you can't defend at renewal. A service quality scorecard puts first-time fix, response time, callbacks, and satisfaction on one graded view, so you know where to coach the team and the client sees the value in writing. OxMaint AI pulls most of these metrics automatically from work orders and surveys, turning a spreadsheet nobody updates into a live scorecard that drives both internal improvement and premium client relationships.
A Scorecard Does Two Jobs at Once
The same numbers that tell you where to coach the team are the numbers that prove your value to the client — one scorecard, two audiences. Start free and build both views from one dataset in OxMaint AI.
The Metrics Worth Scoring
A scorecard is only as good as the metrics on it. Group them into what the client feels, how the team performs, and whether the work holds. Book a demo to assemble your metric set in OxMaint AI.
Benchmark Bands: What "Good" Looks Like
A number needs a reference to mean anything. These are common commercial bands — underperforming, average, and top performer — for the core quality metrics. Start free and grade every metric against its band in OxMaint AI.
| Metric | Underperforming | Average | Top performer |
|---|---|---|---|
| First-time fix rate | < 75% | 75–85% | 85–95% |
| Callback / rework rate | > 12% | 5–12% | < 5% |
| Customer satisfaction (CSAT) | < 4.0 / 5 | 4.0–4.5 | 4.5–5.0 |
| Billable utilization | < 55% | 55–70% | 70–82% |
| Calls completed per day | < 3 | 3–5 | 5–8 |
| Certification compliance | < 90% | 90–98% | 100% |
Set your own targets by client and contract — these bands are a starting reference, not a universal standard. Book a demo to configure your own thresholds in OxMaint AI.
When Renewal Is About Price, You've Already Lost the Framing.
A client who can't see your value negotiates on the only number they have — the invoice. A scorecard gives them a better one: fix rates climbing, callbacks falling, response times held. OxMaint AI builds that record automatically, so the renewal conversation is about the performance you delivered, not the price you charge.
Presenting the Scorecard So It Lands
The data only wins the renewal if the client can read it in a glance. How you present the scorecard matters as much as what's on it. Start free and generate client-ready scorecards in OxMaint AI.
How OxMaint AI Builds the Scorecard
The reason scorecards fail is manual data entry — nobody keeps them current. OxMaint AI captures most metrics from the work already flowing through the system. Start free and let the scorecard build itself in OxMaint AI.
Frequently Asked Questions
Measure the Quality, Then Let It Speak for You.
Good work that nobody measures is invisible when the contract is on the line. A service quality scorecard makes it visible — graded metrics that tell your team where to improve and tell your client exactly what they're paying for. OxMaint AI builds it from the work orders you already run, grades it against benchmark, and hands you a client-ready view — so quality stops being a claim and becomes the number that keeps the renewal.