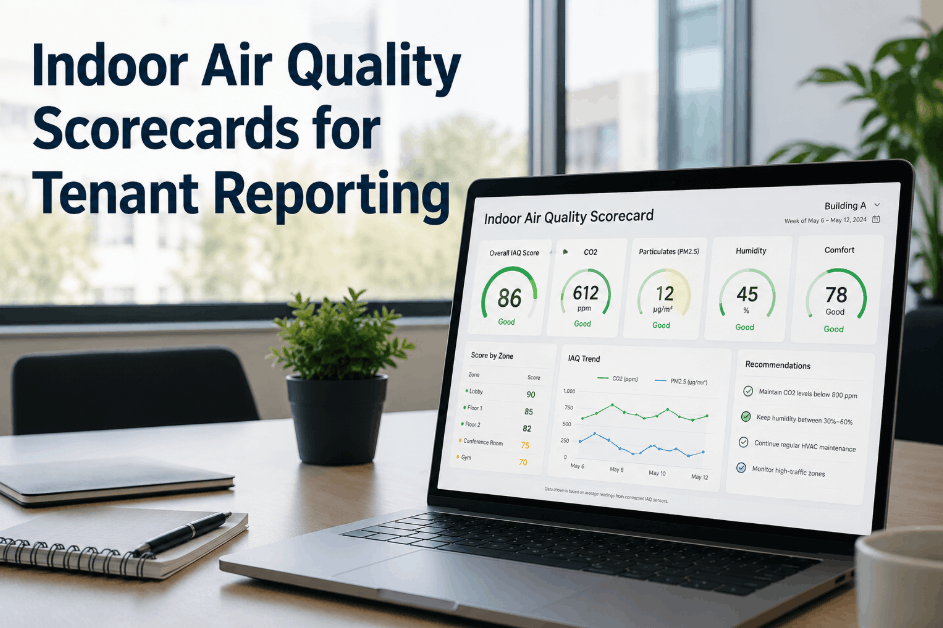
Commercial property teams collect indoor air quality data from sensors scattered across floors and zones, but most of that data never reaches the people who need it most — tenants asking whether their space is healthy and property managers trying to prove it. Raw sensor feeds and monthly PDF exports do not answer the question tenants actually ask: is this floor, this wing, this conference room performing better or worse than last quarter. Sign Up Free to see how Oxmaint turns CO2, particulate, humidity, and comfort data into zone-by-zone scorecards tenants can actually read — or Book a Demo to walk through a live scorecard for your portfolio.
Indoor Air Quality · Tenant Reporting · Zone Scorecards
Stop Answering Tenant Air Quality Questions With Raw Sensor Exports
Oxmaint converts continuous CO2, PM2.5/PM10, humidity, and comfort readings into scorecards your leasing and facilities teams can hand to tenants without a translation layer.
The Reporting Gap
Why Sensor Data Alone Does Not Satisfy Tenant Air Quality Requests
1,000 ppm
Commonly referenced CO2 threshold above which ASHRAE guidance flags inadequate outdoor air relative to occupancy in a zone.
35 µg/m³
Typical 24-hour PM2.5 reference level used by facility teams to flag particulate events that warrant tenant notification.
30-60%
Relative humidity range most commercial leases and building health guidance treat as the comfort and mold-prevention band.
6+
Average number of sensor types per floor — CO2, particulate, humidity, temperature, VOC, occupancy — that tenant reports must reconcile into one view.
Scorecard Structure
What a Zone-Based Indoor Air Quality Scorecard Actually Tracks
A scorecard only earns trust with tenants when it tracks the same parameters a building engineer would check during a complaint walk-through — not a generic air quality index. Oxmaint structures scorecards around four parameter groups per zone, each compared against the prior reporting period so trend direction is visible at a glance. Sign Up Free to configure scorecards for your own floor plan and zone boundaries, or Book a Demo to see a sample tenant-facing report.
CO2 / Ventilation Adequacy
Average and peak CO2 by zone during occupied hours, flagged against outdoor baseline plus ventilation rate targets.
Particulate Load (PM2.5/PM10)
Rolling 24-hour particulate averages with event flags tied to filtration changes, construction activity, or outdoor smoke events.
Humidity & Temperature Comfort
Percentage of occupied hours each zone stayed within the comfort and mold-prevention band, by floor and orientation.
Complaint Correlation
Tenant-reported comfort tickets overlaid against sensor readings to confirm whether a complaint maps to a measurable condition.
| Zone | Avg CO2 (Occupied) | PM2.5 24-hr Avg | Humidity Band Compliance | Trend |
|---|
| Floor 4 – West Wing | 720 ppm | 9 µg/m³ | 96% | Stable |
| Floor 4 – Conference Core | 1,150 ppm | 11 µg/m³ | 88% | Watch |
| Floor 7 – Open Plan | 810 ppm | 14 µg/m³ | 91% | Improving |
| Floor 9 – South Wing | 690 ppm | 8 µg/m³ | 97% | Stable |
Tenant-Ready Reporting
Give Tenants a Scorecard, Not a Spreadsheet
Oxmaint builds zone scorecards directly from your existing sensor feeds, with trend comparison and complaint correlation built in for leasing and operations teams.
FAQs
Frequently Asked Questions
What sensor data does an Oxmaint IAQ scorecard require?
Oxmaint reads existing CO2, particulate, humidity, and temperature sensor feeds by zone — no proprietary hardware is required to generate a scorecard.
Can tenants receive scorecards directly, or only the property team?
Scorecards can be shared as tenant-facing reports or kept internal for facilities and leasing teams, depending on your reporting policy.
How often are zone scorecards updated?
Scorecards refresh continuously from live sensor data, with configurable reporting periods for weekly, monthly, or quarterly tenant summaries.
Does Oxmaint flag zones that fall outside comfort or ventilation targets?
Yes. Zones crossing CO2, particulate, or humidity thresholds are flagged automatically so facilities teams can act before a tenant complaint arrives.
Every Zone Accounted For
Turn Air Quality Sensor Data Into a Report Tenants Trust
Oxmaint structures continuous IAQ data into zone scorecards your leasing, facilities, and compliance teams can rely on without manual spreadsheet work.