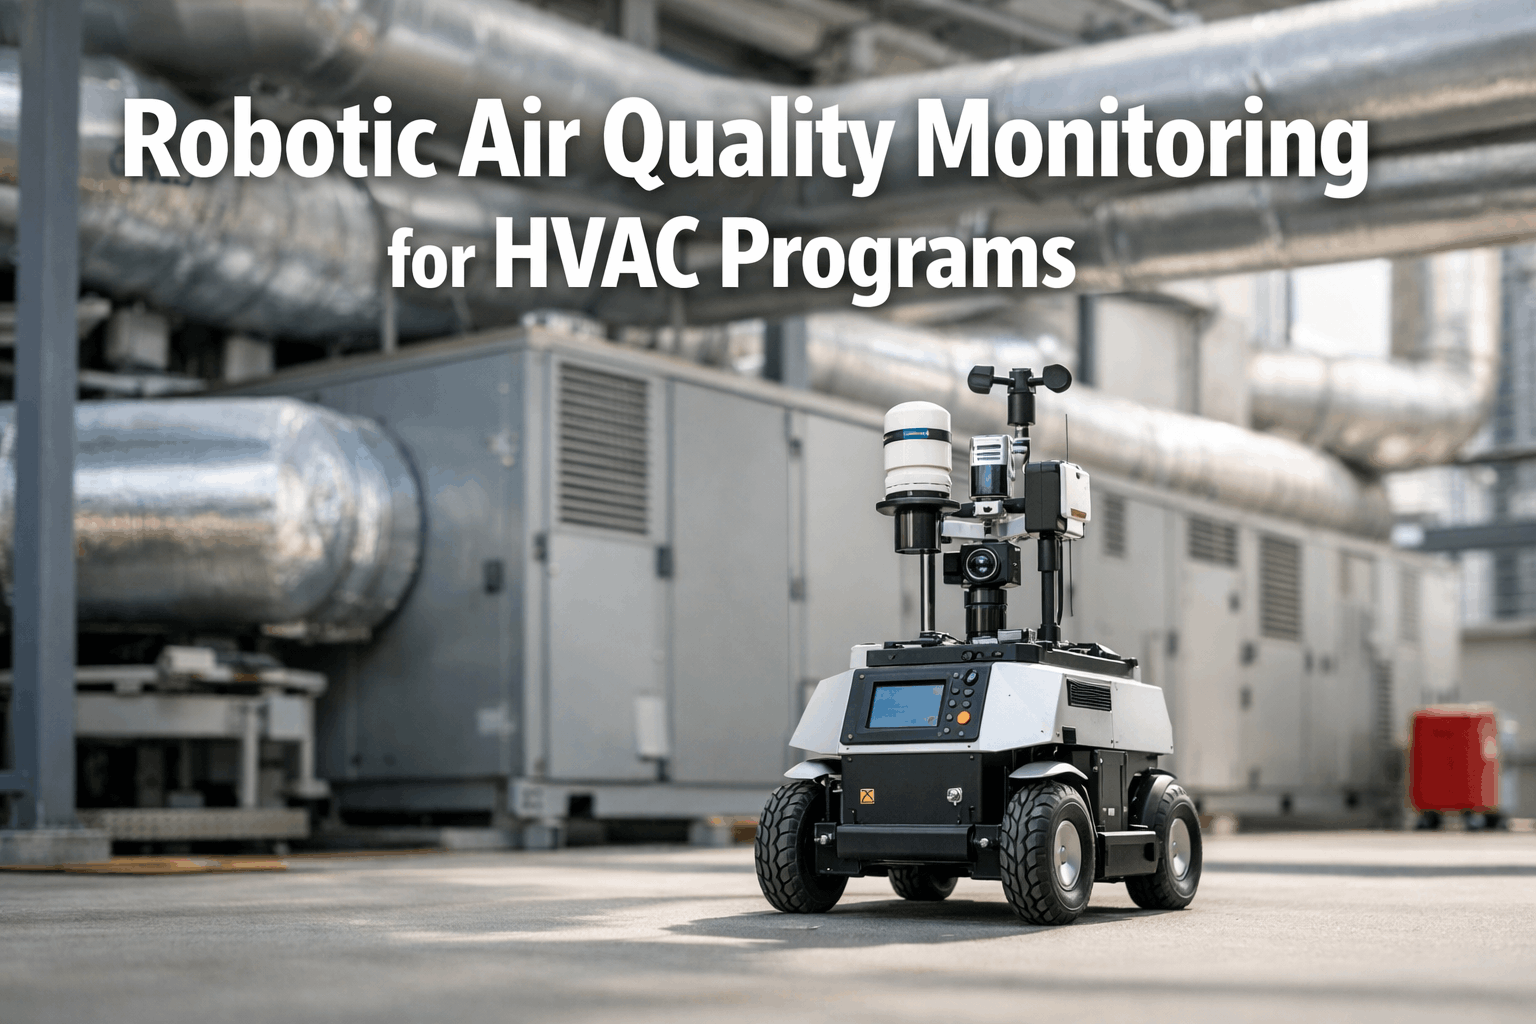
People spend approximately 90% of their time indoors, yet indoor air can be 2-5 times more polluted than outdoor air according to the EPA. Traditional air quality monitoring relies on fixed sensors that capture data at a single point — missing the spatial reality of how pollutants, CO₂, humidity, and temperature actually vary across a building. Robotic air quality monitoring changes the equation entirely. Autonomous mobile robots equipped with multi-parameter IAQ sensors create continuous, spatial air quality maps as they patrol building zones — detecting ventilation dead zones, CO₂ hotspots, VOC sources, and HVAC system imbalances that fixed sensors simply cannot see. The IAQ monitor market was valued at $5.03-7.95 billion in 2024, growing at 8-9% CAGR, while 42% of U.S. commercial buildings have already installed smart air quality monitoring. Over 35% of new commercial HVAC installations now include integrated IAQ monitoring, and 60% of commercial offices in major U.S. metros deploy IAQ sensors. By mounting sensors on autonomous platforms instead of walls, facility managers get building-wide air quality intelligence at a fraction of the sensor deployment cost — with one mobile robot replacing dozens of fixed monitoring points.
When a robot detects a CO₂ spike in a conference wing or identifies a VOC source near a supply duct, that finding needs to trigger investigation and corrective action — not just appear on a dashboard. Oxmaint CMMS connects robotic IAQ monitoring to your HVAC maintenance workflow, auto-generating work orders when air quality parameters breach thresholds, linking findings to specific HVAC zones, and tracking remediation to completion. Talk to our team.
One Robot Replaces
Dozens of Fixed Sensors
Autonomous mobile robots create continuous, spatial air quality maps across entire buildings — detecting ventilation failures, pollutant sources, and HVAC imbalances that wall-mounted sensors miss.
Turn IAQ Robot Data Into HVAC Maintenance Action
Oxmaint connects robotic air quality findings to your HVAC work order system — auto-generating corrective tasks when CO₂, VOC, PM2.5, or temperature parameters breach thresholds in any zone of your building.
6 IAQ Parameters Robots Monitor — and What They Mean for HVAC
Carbon Dioxide
Elevated CO₂ indicates insufficient ventilation. Above 1,000 ppm, cognitive performance drops by 25%. Robot patrols detect which zones accumulate CO₂ during peak occupancy — revealing undersized AHUs, closed dampers, or failed demand-controlled ventilation.
Particulate Matter
PM2.5 particles penetrate deep into lungs. Robot mapping shows where particles accumulate — near loading docks, printer rooms, or areas with poor filtration. US EPA lowered annual PM2.5 standard to 9 µg/m³ in 2024, tightening requirements.
Volatile Organic Compounds
VOCs from cleaning products, furnishings, adhesives, and building materials cause headaches, dizziness, and long-term health effects. Robots trace VOC plumes to their source — identifying which rooms or materials are emitting, not just that levels are elevated somewhere.
Temperature Mapping
Fixed thermostats measure one wall location. Robots map temperature gradients across entire floors — revealing solar heat gain zones, under-served areas far from diffusers, and thermal stratification that causes occupant complaints despite thermostat readings showing normal.
Relative Humidity
Below 30% RH causes static, dry skin, and increased virus transmission. Above 60% promotes mold growth, dust mites, and condensation damage. Robot patrols reveal microclimates — areas where humidity deviates from building averages, indicating local HVAC issues.
Ozone
Indoor ozone comes from outdoor air infiltration, copiers, printers, and UV disinfection systems. Robots map ozone concentrations to identify equipment-generated hotspots near copy rooms and areas where outdoor ozone infiltrates through intake louvers during high-ozone days.
From Air Quality Readings to HVAC Corrective Action
When robot sensors detect parameters outside thresholds, Oxmaint auto-generates HVAC work orders — linked to the specific zone, with sensor data attached, assigned to the right technician, and tracked through completion.
Building Types: Where Robotic IAQ Monitoring Has the Most Impact
Office Buildings
CO₂ mapping during peak occupancy reveals under-ventilated conference rooms and open-plan zones. Robot patrols during and after hours capture occupancy-driven IAQ patterns. 45% of Fortune 500 firms now integrate air quality sensors into wellness programs.
Healthcare Facilities
Critical for infection control — monitoring PM, bioaerosols, and pressure differentials between isolation rooms, ORs, and corridors. Robots verify negative/positive pressure zones without disrupting patient care.
Schools & Universities
30% of childhood asthma is linked to indoor air pollution. Robot monitoring verifies ventilation adequacy across classrooms — particularly critical as 30% of classrooms use only basic CO₂ sensors. Full IAQ profiling reveals which rooms need HVAC attention.
Data Centers
Precise temperature and humidity control is essential for equipment reliability. Robots map thermal gradients between hot and cold aisles, detect humidity deviations, and identify particulate contamination from outside air that corrodes sensitive electronics.
From Robot Patrol to Maintenance Action: The Workflow
Robot Patrols Building
Autonomous route covering all HVAC zones. Multi-parameter sensing: CO₂, PM2.5, VOC, temp, humidity, O₃. GPS-tagged readings every 2-5 seconds. Full building scan in 2-4 hours.
AI Builds Heat Maps
Machine learning processes spatial sensor data. Generates zone-by-zone IAQ heat maps. Identifies anomalies, gradients, and source locations. Compares against ASHRAE/WELL/LEED thresholds. Trending against historical baselines.
CMMS Creates Work Orders
Threshold breaches auto-generate HVAC work orders in Oxmaint. Assigned to zone, tagged with parameter data + heat map. Priority based on severity and building type. Linked to specific AHU, VAV, or diffuser asset.
Verify & Close Loop
After HVAC correction, robot re-patrols affected zones. Before/after IAQ comparison confirms fix effectiveness. Data stored in asset history for compliance documentation. Next patrol cycle auto-scheduled.
Frequently Asked Questions
How does robotic IAQ monitoring work for HVAC programs?
Autonomous mobile robots equipped with multi-parameter sensors (CO₂, PM2.5, PM10, VOC, temperature, humidity, ozone, formaldehyde) patrol building zones on scheduled routes, taking GPS-tagged air quality readings every 2-5 seconds. This creates continuous spatial IAQ maps — unlike fixed sensors that capture single-point data. The robot's AI system processes data to generate zone-by-zone heat maps, identifies parameter breaches against ASHRAE 62.1, WELL v2, or custom thresholds, and detects spatial gradients that reveal ventilation dead zones, pollutant sources, and HVAC imbalances. When anomalies are detected, the system can auto-generate HVAC corrective work orders linked to specific zones and equipment, with sensor data and heat maps attached as evidence. A single robot can replace 20-50+ fixed sensors while providing dramatically richer spatial data, making it both more cost-effective and more informative than traditional fixed monitoring.
What IAQ parameters should robots monitor for HVAC optimization?
Six core parameters drive HVAC corrective actions: CO₂ (400-5000 ppm range, above 1000 ppm indicates insufficient ventilation and causes 25% cognitive performance drop); PM2.5 (EPA lowered annual standard to 9 µg/m³ in 2024 — elevated levels indicate filtration failures or duct leaks); VOC/TVOC (1 µg/m³ resolution detects off-gassing from materials, cleaning products, and equipment); Temperature (20-26°C comfort zone — robots reveal spatial gradients invisible to wall thermostats); Relative Humidity (40-60% ideal — below 30% increases virus transmission, above 60% promotes mold); Ozone (identifies infiltration during high-ozone days and equipment-generated hotspots). Additional parameters for specialized buildings include formaldehyde (HCHO), NO₂, CO, and barometric pressure. Multifunctional sensors measuring 6-8 parameters simultaneously now account for 62% of new IAQ sensor deployments.
Which buildings benefit most from robotic air quality monitoring?
Buildings with high occupant sensitivity, regulatory requirements, or complex HVAC zones see the greatest ROI: Healthcare facilities — infection control requires continuous monitoring of pressure differentials, PM levels, and bioaerosol risk across isolation rooms, ORs, and patient areas (ASHRAE 170 compliance); Office buildings — 45% of Fortune 500 companies integrate IAQ sensors into wellness programs, with WELL v2 and LEED certifications driving adoption; Schools and universities — 30% of childhood asthma linked to indoor pollution, making ventilation verification critical; Data centers — precise temperature/humidity mapping between hot and cold aisles protects equipment worth millions; Commercial mixed-use — retail, food service, and office zones with different ventilation needs in one building create complex IAQ challenges that spatial monitoring solves. Robot monitoring is particularly valuable in buildings larger than 25,000 sq ft where dozens of fixed sensors would be needed for equivalent coverage.
How does IAQ robot data integrate with CMMS and BMS?
Integration works at three levels: Data collection — robots capture GPS-tagged IAQ readings every 2-5 seconds during patrol, transmitting via Wi-Fi/5G to a cloud platform that generates spatial heat maps and identifies threshold breaches. BMS integration — robot findings feed into building management systems via BACnet, Modbus, or REST APIs, providing mobile sensor data alongside fixed-sensor readings for comprehensive building intelligence. CMMS integration — when parameters breach thresholds, the system auto-generates work orders in your maintenance platform (Oxmaint), linked to the specific HVAC zone and equipment (AHU, VAV box, diffuser), with sensor data and heat maps attached as diagnostic evidence. After repair, the robot re-patrols the affected zone to verify the fix, creating before/after documentation for compliance records. This closed-loop workflow ensures every air quality finding drives corrective maintenance action and is tracked to resolution.
Make Every Breath in Your Building Count
Oxmaint connects robotic IAQ monitoring to your complete HVAC maintenance program — threshold-triggered work orders, zone-level asset tracking, compliance documentation, and before/after verification for every building in your portfolio.