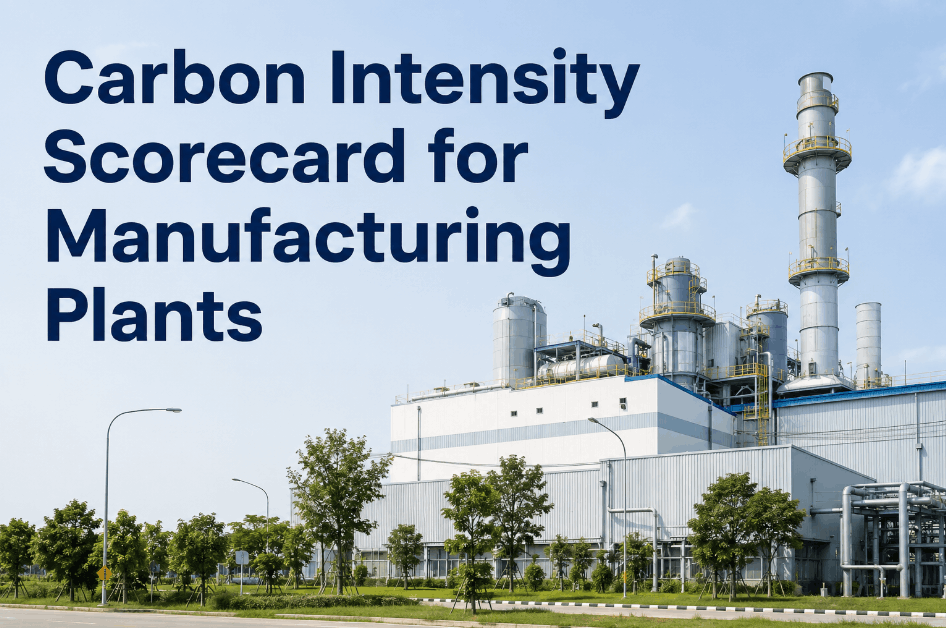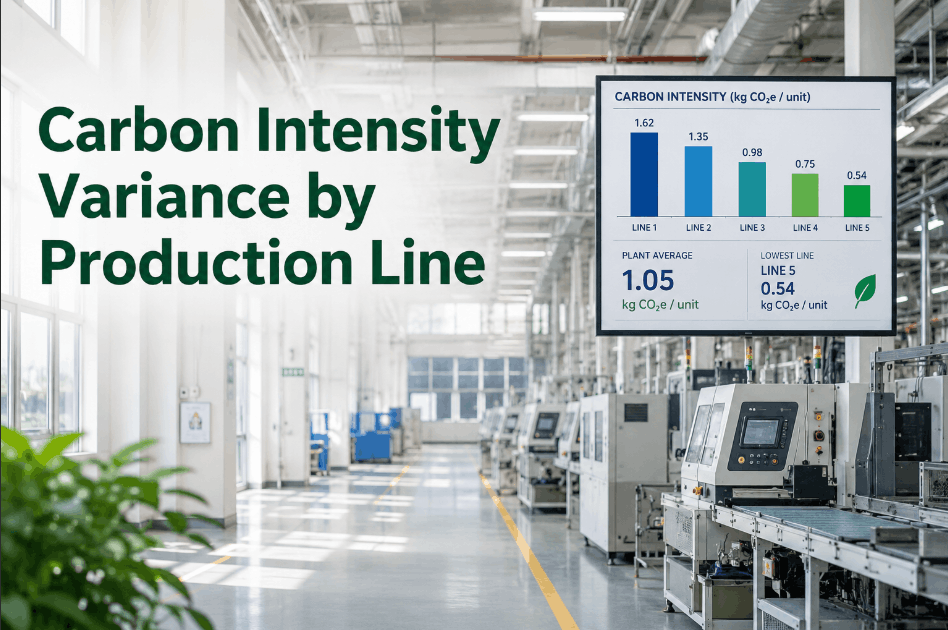
Carbon intensity varies significantly across production lines within the same facility — but most factories cannot quantify it. When energy consumption data is not linked to individual line output records, carbon accounting becomes a facility-level estimate rather than a line-level measurement. Operations teams using Sign Up Free on OxMaint can connect asset energy data, maintenance records, and production output to build the line-level carbon intensity baseline that ESG reporting and reduction programs require. Understanding where carbon burden runs highest — and why — transforms sustainability from a reporting obligation into an operational improvement lever. Book a Demo to explore how OxMaint supports carbon intensity tracking at the production line level.
Why Carbon Intensity Varies Across Production Lines
Carbon intensity differences between production lines in the same facility reflect a mix of equipment age, maintenance condition, process efficiency, and utility allocation. Book a Demo to see how OxMaint links asset condition records and energy data to support line-level carbon intensity comparison and reduction targeting.
Six Drivers of Carbon Intensity Variance Between Production Lines
Carbon intensity differences across lines are rarely random — they trace to specific maintenance, equipment, and operational conditions. Sign Up Free to connect asset condition data and energy records in OxMaint and begin building the line-level carbon intensity baseline your ESG reporting and reduction targets require.
Asset Maintenance Condition and Energy Draw
Degraded motors, clogged filters, misaligned drives, and failing heat exchangers all increase energy consumption per unit of output. Lines with deferred maintenance carry structurally higher carbon intensity than equivalent lines maintained on schedule — a connection rarely captured without asset-level energy tracking.
Equipment Age and Efficiency Baseline
Older production equipment operates at lower energy efficiency ratings than modern equivalents. Lines running legacy equipment carry a structural carbon intensity disadvantage that maintenance cannot fully correct — making equipment age a key variable in cross-line carbon intensity comparison and capital planning.
Idle Energy and Startup Consumption Patterns
Lines with high idle-to-run ratios — frequent changeovers, low utilization schedules, or unplanned stoppages — consume disproportionate energy per unit produced. Tracking idle time against energy consumption by line reveals where scheduling and uptime improvement opportunities carry the highest carbon intensity reduction value.
Utility Infrastructure Allocation and Leakage
Compressed air leaks, steam losses, and chilled water inefficiencies add carbon burden to specific lines without appearing in production metrics. Linking utility asset records to line-level consumption in OxMaint surfaces infrastructure-driven carbon intensity that maintenance intervention can reduce.
Process Controls Lag and Setpoint Drift
Lines with unserviced controls or drifting setpoints consume more energy maintaining process conditions than correctly calibrated equivalents. Tracking controls calibration history against energy consumption in OxMaint identifies where controls maintenance delivers measurable carbon intensity reduction.
Product Mix and Output Density Variation
Lines producing lower-density or more complex product mixes may carry higher carbon intensity per unit of output regardless of equipment condition. Normalizing carbon intensity by production output type — rather than raw unit count — is essential for valid cross-line comparison and accurate ESG reporting.
Carbon Intensity Tracking by Production Line Category
Book a Demo to explore how OxMaint structures asset energy records, maintenance history, and production output data to enable line-level carbon accounting and emissions reduction targeting across facility operations.
| Line Category | Primary Carbon Intensity Driver | Key Tracking Metric | Reduction Lever | OxMaint Data Connection |
|---|---|---|---|---|
| High-Temperature Process Lines | Thermal efficiency losses, insulation degradation | Energy per unit at rated vs. actual temperature | Insulation maintenance, setpoint control | Thermal asset records with maintenance history |
| Compressed Air-Dependent Lines | Leakage losses, over-pressure operation | Compressed air consumption per production cycle | Leak detection program, pressure optimization | Utility asset inspection records by line |
| High-Changeover Batch Lines | Idle energy during changeover and startup | Energy per unit including idle periods | Changeover time reduction, smart shutdown | Changeover work order records with time data |
| Aging Equipment Lines | Structural efficiency gap vs. modern equipment | Energy intensity vs. current-generation benchmarks | Capital replacement planning, PM optimization | Asset age records linked to energy consumption |
| Climate-Controlled Production | HVAC energy burden, controls drift | HVAC energy as percentage of total line consumption | Controls calibration, BAS optimization | HVAC asset maintenance records by production zone |
How Untracked Carbon Intensity Variance Undermines ESG Commitments
Sign Up Free to start building line-level carbon intensity records in OxMaint and connect energy burden data to the asset and maintenance intelligence that makes emissions reduction actionable.
Frequently Asked Questions: Carbon Intensity Variance by Production Line
What is carbon intensity in production line context?
Carbon intensity at the production line level measures greenhouse gas emissions per unit of output — enabling comparison between lines and identification of where energy burden is highest relative to what is produced.
Why does carbon intensity vary between production lines in the same facility?
Variance reflects differences in equipment age, maintenance condition, idle-to-run ratios, utility infrastructure efficiency, and process control accuracy — all of which affect energy consumption per unit of production output.
How does OxMaint support carbon intensity tracking?
OxMaint links asset maintenance records, inspection history, and work order data to energy consumption at the line and asset level — providing the operational context needed to understand and reduce carbon intensity across production lines.
How does maintenance affect production line carbon intensity?
Degraded equipment — worn motors, dirty heat exchangers, leaking compressed air systems — consumes more energy per unit produced. Planned maintenance that restores equipment to rated efficiency directly reduces line-level carbon intensity.
How should carbon intensity data be used in ESG reporting?
Line-level carbon intensity records provide the baseline against which reduction targets are set and progress is measured. Linking maintenance and energy data in OxMaint ensures that ESG reports reflect actual operational performance rather than facility-level estimates.