Most manufacturing plants generate maintenance data every shift — work orders, downtime events, parts transactions, technician hours, asset readings. Very few of them turn that data into decisions. The CMMS captures the inputs but the insights stay buried in raw exports, and the maintenance manager walks into the operations meeting with gut feel instead of evidence. The cost is measurable: facilities that actively track core reliability KPIs achieve 28% faster mean time to repair, 34% higher asset uptime, and 41% better resource allocation than those running on static reports — yet most maintenance teams still do not have a live dashboard showing PM compliance, MTBF, or planned-to-reactive ratios. Analytics is what closes that gap, turning a CMMS from a record-keeping tool into a decision engine. Book a 30-minute demo to walk through OxMaint's analytics dashboards on a live data set and see exactly how this works for your plant.
Maintenance Analytics · CMMS Decision Intelligence
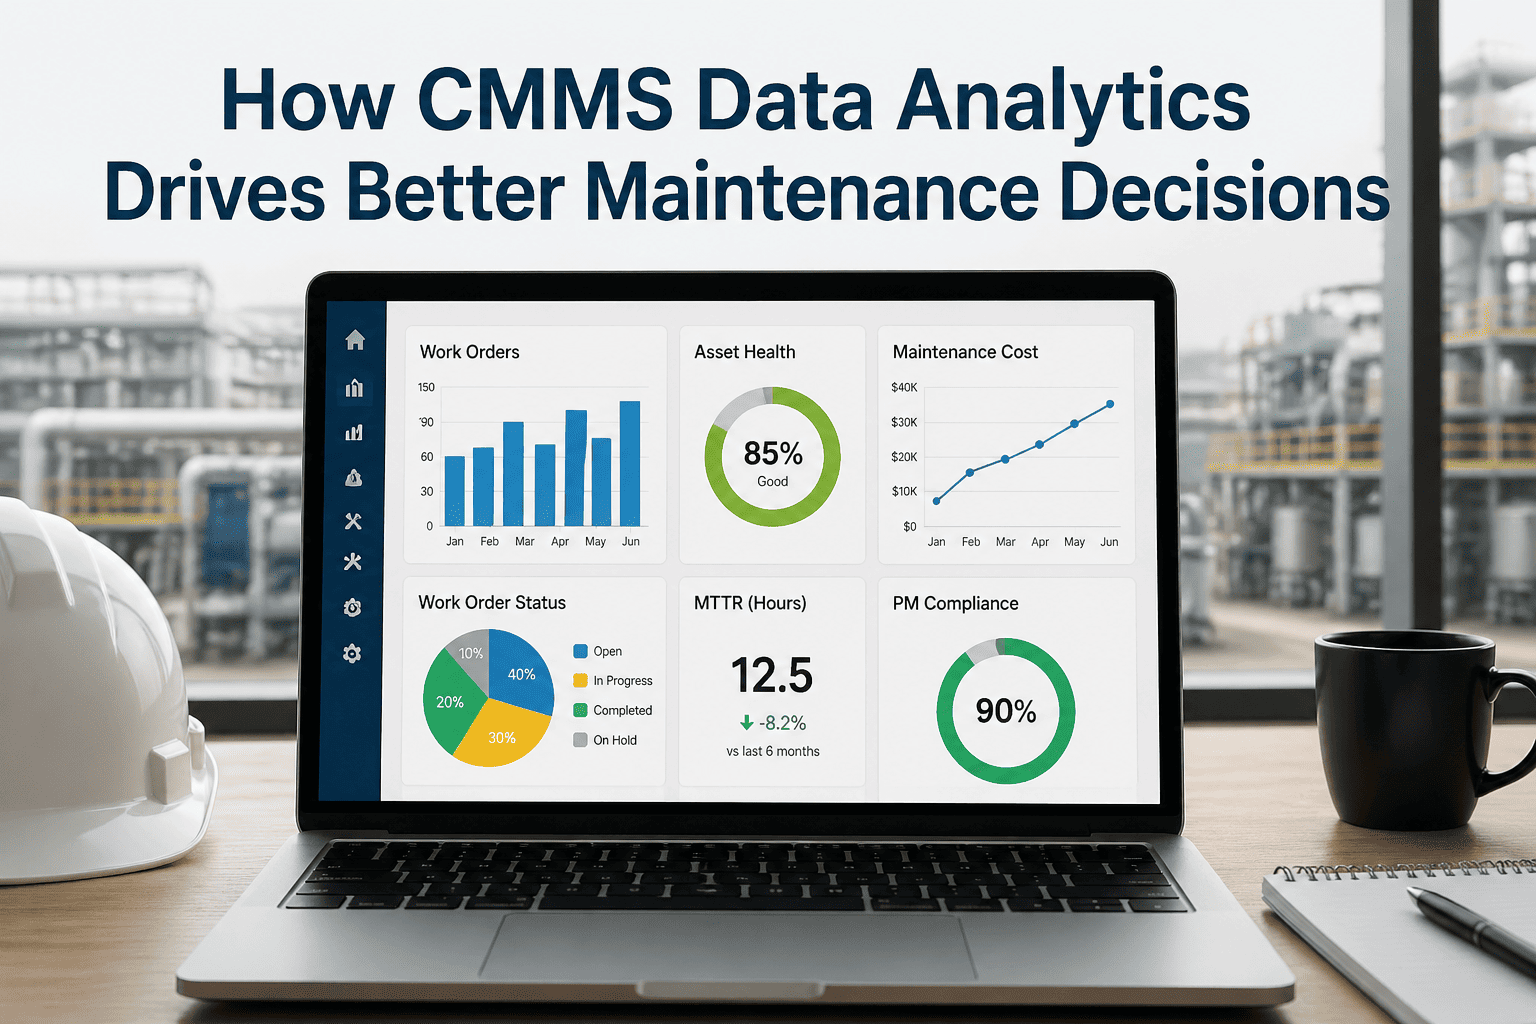
How CMMS Data Analytics Drives Better Maintenance Decisions
From raw work orders to real-time KPIs to AI-driven recommendations — analytics is the layer that turns maintenance data into measurable business outcomes. Plants using structured analytics see 28% faster MTTR, 34% higher uptime, and 30–50% lower downtime with predictive layers active.
The Decision Gap
The Same Data, Two Different Maintenance Operations
Without Analytics
Decisions made on instinct and last week's spreadsheet
Manager spends 6+ hours per week pulling data manually for reports
PM compliance, MTTR, MTBF reported quarterly, if at all
No visibility into which assets are consuming the most resources
Capital requests rejected — no data to justify replacement
Same failures repeat because root cause patterns go undetected
Production blames maintenance; maintenance blames operations
VS
With CMMS Analytics
Decisions made on live KPIs and trended evidence
Live dashboards aggregate KPIs automatically — zero report prep
PM compliance, MTTR, MTBF visible by shift, line, and asset
Top 10 problem assets ranked by downtime cost and labour hours
Replacement proposals approved 2x faster with 12-month cost data
Recurring failure codes flagged automatically for reliability review
Production and maintenance share one source of truth
Analytics Maturity Pipeline
The Four Stages of CMMS Analytics — From Data to Action
Every CMMS generates data. The question is which level of analytics is being applied to it. Most plants are stuck at Stage 1 or Stage 2 — describing what happened — without ever advancing to predicting what will happen or prescribing what to do about it. Each stage adds a new dimension of decision support, and each stage compounds the value of the one before it.
01
Descriptive
What happened?
Reports work order volume, downtime events, completion rates. Most CMMS dashboards stop here. Useful but backward-looking.
Output: Reports & KPIs
02
Diagnostic
Why did it happen?
Root cause analysis, failure code clustering, trend analysis. Connects symptom to source — which asset class fails most, which shift has the highest MTTR.
Output: Patterns & Causes
03
Predictive
What will happen?
ML models trained on historical work orders and sensor data forecast failure windows. PdM adopters report 30–50% downtime reduction and 10–40% lower maintenance cost.
Output: Failure Forecasts
04
Prescriptive
What should we do?
AI recommends optimal maintenance timing, parts staging, and crew assignment — weighing production schedule, inventory, and asset criticality automatically.
Output: Optimised Actions
Six KPIs That Drive Decisions
The Maintenance Metrics That Convert Data into Action
Not every metric a CMMS can produce is a decision-driver. The six KPIs below are the ones that link maintenance performance to business outcomes — and that show up consistently in plants moving from reactive to predictive operations. Each one answers a specific question and triggers a specific decision.
PM Compliance Rate
Completed PMs ÷ Scheduled PMs × 100
Tells you whether your planned maintenance program is actually being executed — the leading indicator of next quarter's reliability.
Decision: If below 85%, investigate scheduling, resourcing, or production-pressure deferrals before reactive work climbs.
MTBF — Mean Time Between Failures
Total Operating Hours ÷ Number of Failures
Tells you how long an asset runs before unplanned failure. Trending MTBF reveals which assets are improving, degrading, or in chronic failure.
Decision: Asset MTBF declining 3 months in a row triggers reliability review or replacement evaluation.
MTTR — Mean Time To Repair
Total Repair Time ÷ Number of Repairs
Tells you how fast your team responds and restores. High MTTR points to parts availability, technician skill gaps, or diagnostic delays.
Decision: MTTR above 4 hours on critical assets triggers spare parts review and technician training audit.
Planned vs Reactive Ratio
Planned Work Orders ÷ Total Work Orders
Tells you the maturity of your maintenance operation. World-class plants run 80%+ planned; reactive-heavy plants sit below 50%.
Decision: Ratio below 70% means the program is firefighting; budget should shift toward PM and condition-monitoring.
Cost Per Asset (12-Month)
Total Maintenance Spend ÷ Asset Replacement Value
Tells you which assets are consuming disproportionate resources. An asset spending 4x category average is a replacement candidate, not a maintenance problem.
Decision: Asset exceeding 2x category average for 3+ months triggers CapEx replacement proposal.
Work Order Backlog (Aged)
Open WOs grouped by 0–7, 8–30, 31+ days
Tells you whether you have a capacity problem, a priority problem, or a resourcing problem. A growing 30+ day bucket means systemic under-resourcing.
Decision: P1 work orders older than 24 hours or P2 over 72 hours need immediate management intervention.
From Data Buried in Spreadsheets to Decisions Made in Minutes
OxMaint's Built-In Analytics Tracks All Six KPIs From Day One
No data team required. No third-party BI tool to license. OxMaint's pre-built dashboards aggregate work order data, asset records, parts transactions, and PM completion in real time — so the maintenance manager walks into every operations meeting with live evidence, not last week's export.
Data-to-Decision Lifecycle
How a Single Work Order Becomes a Strategic Decision
Analytics is not a feature — it is a flow. Every closed work order should pass through five stages, with each stage adding structure that the next stage depends on. When any stage is broken, the decision at the end is unreliable.
01
Capture
Technician closes work order on mobile with structured failure code, labour hours, parts used, and root cause field. No free-text dumps.
02
Structure
Data flows into the asset hierarchy with consistent naming. The bearing replacement on Pump 7-A links to its parent line, criticality class, and category.
03
Visualize
Real-time dashboards aggregate the data into KPI tiles, trend charts, and top-10 lists — no manual export, no waiting for the monthly report cycle.
04
Analyze
Reliability engineer runs failure-code clustering, MTBF trending by asset class, and Pareto analysis of cost drivers — diagnosing root causes weekly, not annually.
05
Act
Insight becomes action: PM interval adjusted, asset flagged for replacement, parts inventory rebalanced, training scheduled — and the cycle restarts with cleaner data.
Manual Reporting vs CMMS Analytics
The Operational Gap Between Spreadsheet-Based and Analytics-Driven Maintenance
The difference is not theoretical. Plants that switch from manual reporting to CMMS analytics see measurable change in how fast decisions get made, how often KPIs are reviewed, and how confidently capital requests get approved.
| Decision Dimension |
Spreadsheet / Manual |
CMMS Analytics (OxMaint) |
Documented Impact |
| Time to compile monthly KPI report |
4–8 hours per cycle |
Live, real-time, zero prep |
6+ hours/week recovered |
| Frequency of KPI review |
Monthly or quarterly |
Daily / shift-level |
30x faster signal-to-action |
| MTTR on critical assets |
Baseline |
28% faster (SMRP 2025) |
Higher uptime, fewer escalations |
| Asset uptime improvement |
Baseline |
+34% (Aberdeen) |
Direct production output gain |
| Resource allocation efficiency |
Baseline |
+41% (Aberdeen) |
Same team, more output |
| CapEx replacement approval speed |
Slow — limited evidence |
2x faster with 12-mo data |
Faster reliability investment |
| Predictive maintenance enablement |
Not possible |
Native ML on clean data |
30–50% downtime reduction |
Sources: SMRP 2025, Aberdeen Group, Deloitte Predictive Maintenance Position Paper, NIST AMS 100-18.
Common Analytics Pitfalls
Three Reasons CMMS Analytics Underperforms — And How to Avoid Each
Adopting a CMMS does not automatically produce useful analytics. The most common reasons analytics initiatives stall are not technical — they are operational. Avoiding these three pitfalls is the difference between a dashboard that drives decisions and a dashboard nobody opens.
01
Garbage In, Garbage Out
Free-text "fixed it" closures, inconsistent asset naming, and missing root cause codes pollute every downstream metric. Without structured data capture, no analytics layer can produce reliable insight.
Fix Lock down structured drop-downs for failure codes, asset hierarchy, and labour categories from day one.
02
Vanity Metrics, Not Decision Metrics
"We closed 150 work orders this week" is a volume metric, not a performance metric. It does not say whether the work was proactive PM or emergency firefighting — and it cannot drive a decision.
Fix Track planned-to-reactive ratio alongside volume; the mix matters more than the count.
03
Dashboards Locked Away From the Floor
Analytics that only the manager sees do not change technician behaviour. When the team has no visibility into MTTR or PM compliance, they have no feedback loop to improve.
Fix Display key KPIs on shop-floor screens and mobile; make performance visible to the people who control it.
Frequently Asked Questions
Common Questions About CMMS Data Analytics
What is the single most important KPI to start tracking first?
PM compliance rate. It is both a leading indicator of future reliability and a direct measure of whether your planned program is being executed. Plants that hit 85%+ PM compliance typically see reactive work orders fall by 25–35% within 6–9 months.
Start a free trial to set up your first compliance dashboard.
How long before CMMS analytics produces useful insights after deployment?
Descriptive KPIs — work order volume, PM compliance, MTTR — are useful from week one. Diagnostic patterns become visible at 60–90 days as failure-code data accumulates. Predictive layers typically need 6–12 months of clean structured data to reach reliable accuracy.
Do we need a separate BI tool like Power BI or Tableau alongside our CMMS?
For most plants, no. OxMaint's built-in dashboards cover the core six KPIs and standard maintenance reporting natively. A standalone BI tool only adds value when you need to blend maintenance data with finance, ERP, or external data sources.
Book a demo to compare native vs blended reporting for your case.
How does CMMS analytics actually justify capital expenditure for replacements?
A 12-month cost-per-asset trend chart compared against asset replacement value gives finance the evidence base they need. Asset replacement proposals supported by trended maintenance cost data are approved more than 2x faster than proposals without supporting data.
Can CMMS analytics integrate with our existing IoT sensors, ERP, and SCADA?
Yes. OxMaint connects to ERP, SCADA, MES, and IoT platforms via standard APIs and protocols (OPC-UA, MQTT, REST), so sensor data, parts inventory, and production data flow into one analytics layer without manual re-entry.
OxMaint · Built-In Maintenance Analytics
Stop Reporting on Maintenance. Start Deciding With It.
The data is already in your CMMS. The question is whether your team is making decisions with it tomorrow morning, or pulling another spreadsheet next quarter. OxMaint's built-in analytics layer turns work order data into live KPIs, trended insights, and AI-powered failure forecasts — without a data team, without a separate BI license, and without a multi-month implementation cycle.