The average manufacturing plant runs at 45–65% Overall Equipment Effectiveness. World-class plants operate at 85%. The 20–40 point gap is not closed by buying better machines or hiring more technicians — it is closed by a methodology that has reshaped Japanese manufacturing for six decades and is now the proven path to zero breakdowns, zero defects, and zero accidents. Total Productive Maintenance (TPM) is not a maintenance department initiative. It is a company-wide production system that engages every operator, technician, and manager in eliminating six specific categories of loss that suppress equipment effectiveness. Plants that implement TPM correctly report 15–30% reductions in maintenance cost, 20–40% gains in equipment availability, 71% drops in unplanned downtime, and OEE climbing from 62% to 86% within 14 months on pilot lines. Plants that implement it incorrectly — and 60–70% do — produce no sustained gains beyond the first year. The difference is rarely about effort. It is about understanding the eight pillars in the right order, picking the right pilot equipment, measuring the Six Big Losses honestly, and digitising the discipline so that autonomous maintenance does not collapse the day the wall-chart yellows. This guide consolidates the full TPM implementation playbook — origins, pillars, losses, roadmap, KPIs, common failure modes, and the modern Industry 4.0 extensions — into a single reference for plant managers, reliability engineers, and operations leaders ready to do this properly. Plants ready to start with a structured pilot can book a 30-minute TPM strategy session to scope the first 90 days.
TPM IMPLEMENTATION GUIDE · 2026
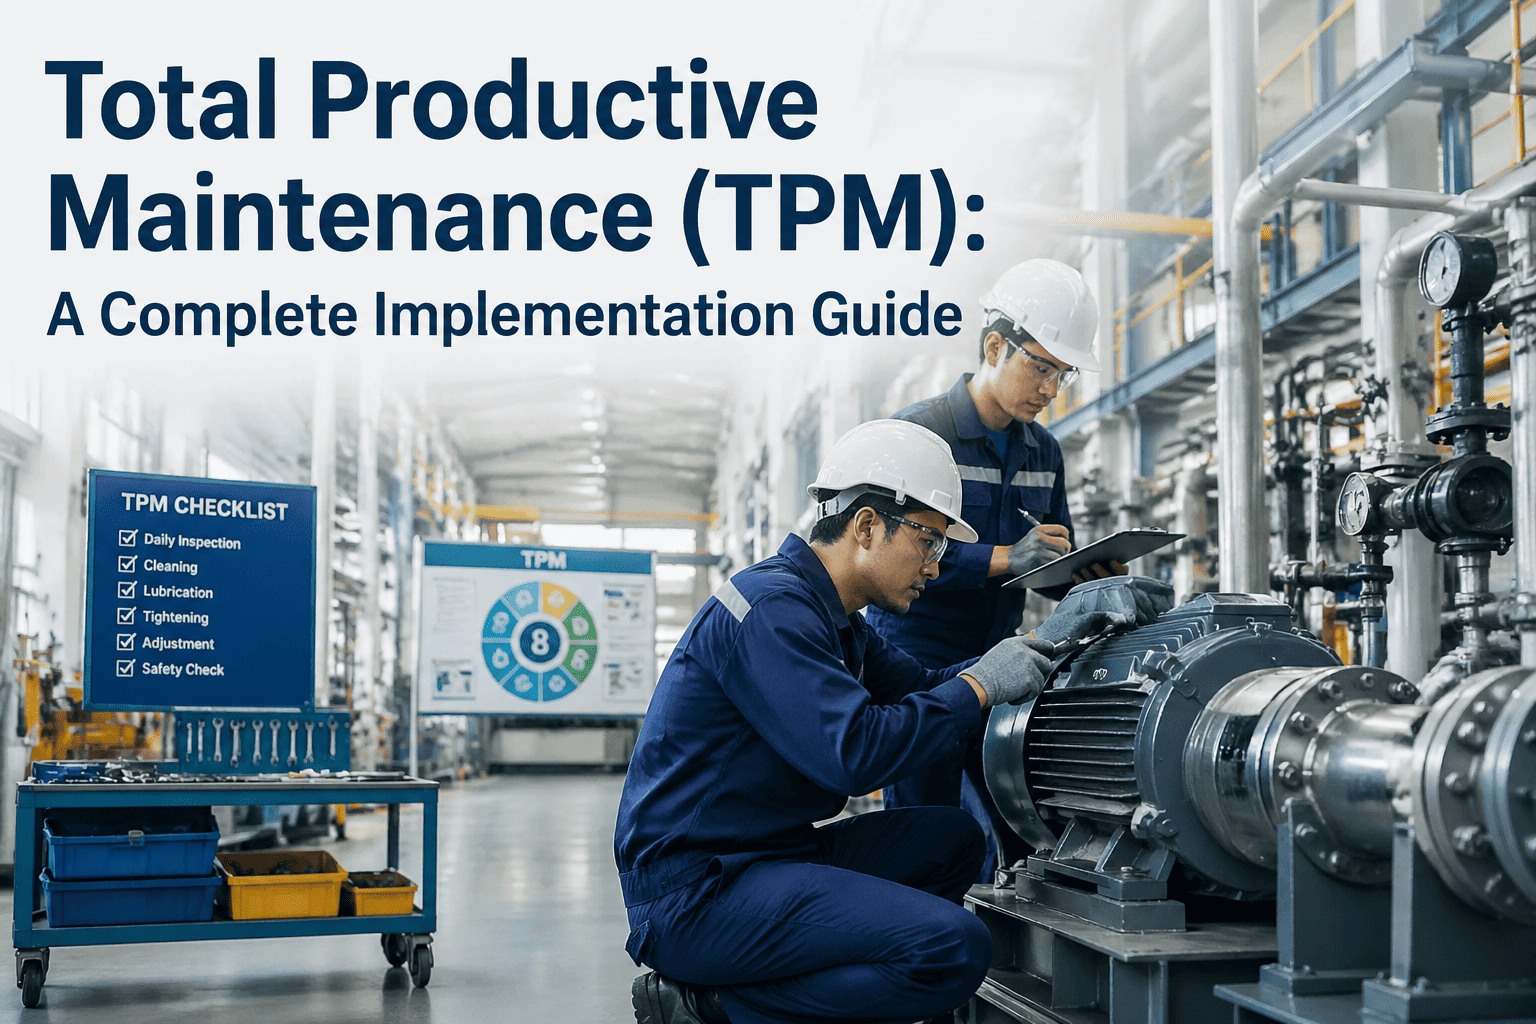
Total Productive Maintenance: A Complete Implementation Guide
All eight pillars · Six Big Losses · 90-day pilot roadmap · OEE benchmarks · success metrics · digital execution · Industry 4.0 extensions — built for manufacturing plants moving from reactive firefighting to perfect production.
What TPM Is — In One Paragraph
Total Productive Maintenance (TPM) is a company-wide equipment management methodology developed in Japan by Seiichi Nakajima in the 1960s. It eliminates the Six Big Losses that suppress production output by transferring routine equipment care from maintenance specialists to the operators who run the machines, while specialists focus on planned maintenance, reliability engineering, and skill transfer. TPM is built on a 5S foundation and supported by eight pillars. The single number that measures TPM progress is Overall Equipment Effectiveness (OEE) — the percentage of planned production time that is genuinely productive.
Goal: Zero Breakdowns · Zero Defects · Zero Accidents
Measured through Overall Equipment Effectiveness (OEE)
P1
Autonomous Maintenance
Foundation: 5S — Sort · Set in Order · Shine · Standardise · Sustain
The Six Big Losses — The Real Targets of TPM
Every TPM activity exists to reduce one of six specific production losses. Mapping each loss to the OEE component it damages, and to the pillar that addresses it, turns TPM from an abstract methodology into an actionable plan. These six categories are nearly universal across discrete manufacturing.
AVAILABILITY LOSS
L1
Equipment Failure
Unplanned breakdowns, tooling failures, electrical faults — any unscheduled stop. Dominant cause of low Availability.
Addressed by: Autonomous Maintenance · Planned Maintenance
AVAILABILITY LOSS
L2
Setup & Adjustments
Time consumed in changeovers, recipe switches, tool changes, and warm-up. Often the largest single Availability loss after breakdowns.
Addressed by: Focused Improvement (SMED) · Training
PERFORMANCE LOSS
L3
Idling & Minor Stops
Brief stops under 5 minutes — sensor trips, jams, misfeeds. Almost always under-recorded; a hidden factory of lost capacity.
Addressed by: Focused Improvement Kaizen · Autonomous Maintenance
PERFORMANCE LOSS
L4
Reduced Speed
Equipment running below ideal cycle time due to wear, poor adjustment, conservative settings, or undertrained operators.
Addressed by: Quality Maintenance · Training & Education
QUALITY LOSS
L5
Process / Production Defects
Defects produced during steady-state running. Often traceable to equipment condition rather than process design.
Addressed by: Quality Maintenance · Focused Improvement
QUALITY LOSS
L6
Reduced Yield (Startup)
Defects produced from startup to stable production — first-piece scrap, warm-up rejects, restart waste.
Addressed by: Quality Maintenance · Early Equipment Management
If you are not measuring all six losses by category, you are not yet practising TPM.
OxMaint captures every stop, classifies it against the Six Big Losses, and links each event to the pillar that fixes it — so your improvement effort lands where the loss actually lives.
The Eight Pillars — Detailed
01
Autonomous Maintenance (Jishu Hozen)
Goal
Operators take ownership of routine equipment care — cleaning, lubrication, tightening, inspection.
Why First
No other pillar succeeds without operator engagement. AM produces 50–60% of TPM's early gains.
7 Steps
Initial cleaning → eliminate contamination sources → set lubrication standards → general inspection training → autonomous inspection → workplace organisation → continuous improvement.
Targets Loss
L1 Equipment Failure · L3 Minor Stops
Goal
Schedule technical maintenance before failures occur — using interval-based, condition-based, and predictive triggers.
Owned By
Maintenance department — supported by failure history, MTBF data, and CMMS-driven scheduling.
Key Metric
PM Compliance (target 95%+) · Planned vs Unplanned ratio (target 80:20 or better)
Targets Loss
L1 Equipment Failure · L4 Reduced Speed
03
Focused Improvement (Kobetsu Kaizen)
Goal
Cross-functional teams attack one defined loss at a time using structured root cause analysis and PDCA cycles.
Tools
Pareto · Fishbone · 5 Whys · FMEA · SMED for changeover · A3 problem solving.
Cadence
4–6 week Kaizen events with measurable OEE impact target. Never general improvement — always one specific loss.
Targets Loss
L2 Setup · L3 Minor Stops · L5 Process Defects
04
Quality Maintenance (Hinshitsu Hozen)
Goal
Identify the equipment conditions that cause defects ("Q-points") — and maintain those conditions in tolerance.
Logic
Defects are not random. Worn guides, misaligned shafts, drifting sensors all leave product fingerprints. Fix the cause, not the inspection.
Output
Maintenance tasks linked to specific quality outcomes — converting quality from inspection-based to prevention-based.
Targets Loss
L5 Process Defects · L6 Startup Yield
05
Early Equipment Management
Goal
Apply maintenance learning to new equipment design and procurement — before installation, not after.
Inputs
Failure history of similar machines · operator feedback · maintainability requirements · LCC analysis.
Outcome
Vertical startup, lower lifetime maintenance cost, machines that don't repeat the failure modes of the previous fleet.
Targets Loss
L6 Startup Yield · L1 Equipment Failure (long-term)
Goal
Build the technical skill base in operators, technicians, and managers required to sustain all other pillars.
Method
Skills matrix · OPL (One-Point Lessons) · cross-training · certification pathways for AM and PM levels.
Why Critical
40% workforce retirement by 2030 makes knowledge capture the highest-ranked AI use case in maintenance.
Targets Loss
L4 Reduced Speed · L5 Process Defects · L2 Setup
07
Safety, Health & Environment (SHE)
Goal
Eliminate accidents and environmental incidents through hazard identification, risk-based prevention, and operator engagement.
Connection
Aligned with ISO 45001 and ISO 14001. Autonomous Maintenance checklists embed safety inspection at the source.
Insight
Plants achieving Zero Breakdowns and Zero Defects almost always achieve Zero Accidents — because the underlying disciplines are the same.
Targets Loss
All six losses indirectly — through workforce engagement
08
Office TPM (Administrative TPM)
Goal
Eliminate waste in administrative processes that support production — procurement, scheduling, planning, finance.
Targets
Spare parts stockouts · work order administrative cycle time · invoicing rework · production scheduling errors.
Why It Matters
Plant teams cannot achieve world-class OEE if a stockroom or procurement process is generating delays measured in days.
Targets Loss
L1 Failure (parts delay) · L2 Setup (admin lag)
The 90-Day Pilot Roadmap
TPM is a multi-year programme but the first 90 days determine whether it survives. This roadmap concentrates effort on a single pilot line, the two foundational pillars, and the OEE baseline that will prove value before expansion. Skipping the baseline measurement is the most common reason early TPM programmes lose executive sponsorship.
Phase 1
Days 1–14
Pilot Selection & Baseline
Choose pilot equipment using one of three approaches — Easiest to Improve (recommended for first programme), Bottleneck (highest immediate ROI), or Worst Performer (largest absolute gain). Establish current OEE, MTBF, MTTR, and full Six Big Losses breakdown. Without this baseline, no improvement claim can be defended.
Output: Documented baseline OEE · Six Big Losses pareto · pilot team named
Phase 2
Days 15–35
Restore & Initiate AM
Initial cleaning event ("AM Step 1") — restore equipment to a state where deterioration is visible. Eliminate contamination sources. Build first autonomous maintenance checklists with operators co-authoring them. Train operators on lubrication standards. This step is non-negotiable — it is where operator ownership begins.
Output: Equipment restored · operator AM checklists live · daily inspection routine running
Phase 3
Days 36–60
Planned Maintenance Programme
Build the PM schedule from failure history and manufacturer data. Load all PMs into the CMMS. Begin tracking PM compliance and the Planned-vs-Unplanned maintenance ratio weekly. Maintenance teams transition from firefighting to scheduled execution. The pilot now has both pillars running in parallel.
Output: PM schedule live · 80%+ PM compliance · MTBF tracked per asset
Phase 4
Days 61–90
First Kaizen & Measure Gain
Run the first Focused Improvement Kaizen on the largest loss in the baseline pareto. Time-box to four weeks. Measure OEE weekly against baseline. Document the gain. Build the business case for expansion to the second line. Plants that reach Day 90 with a documented OEE improvement and a structured rollout plan have a TPM programme that lasts.
Output: 5–15 point OEE improvement · first Kaizen documented · expansion plan signed off
OEE — The Single Number That Measures TPM
OEE is the only metric that captures all three categories of loss in one figure. World-class is 85% — a benchmark drawn from Nakajima's original work and upheld across 60 years of TPM practice. The composition of world-class OEE is precise: 90% Availability × 95% Performance × 99% Quality.
AVAILABILITY
90%
Run Time ÷ Planned Production Time
Damaged by Losses 1 & 2
×
PERFORMANCE
95%
(Total Count × Ideal Cycle Time) ÷ Run Time
Damaged by Losses 3 & 4
×
QUALITY
99%
Good Count ÷ Total Count
Damaged by Losses 5 & 6
=
| OEE Range | Tier | Typical Profile | TPM Maturity |
| Below 40% |
Sub-standard |
Heavy reactive maintenance; minimal data capture; chronic stops |
No structured TPM |
| 40–60% |
Common Starting Point |
Some PMs in place; weak operator engagement; Six Losses unmeasured |
Pre-pilot or aborted programme |
| 60–75% |
Average Manufacturer |
CMMS deployed; PM compliance 60–80%; partial AM rollout |
Pillars 1–2 active |
| 75–85% |
Top Quartile |
All 8 pillars active; mature Kaizen culture; Q-points managed |
Mature TPM programme |
| 85%+ |
World Class |
Sustained 85%+ across critical lines; predictive layer added |
TPM 4.0 maturity |
Documented Outcomes from TPM Implementations
+20-40%
Equipment availability gain at maturity
15-30%
Reduction in total maintenance cost
71%
Drop in unplanned downtime — FMCG case (14 months)
62→86%
OEE jump on packaging line in 14 months
90→28 min
Changeover time after SMED Kaizen
8-16x
Annual return on TPM programme investment
A 1% OEE gain on a high-speed manufacturing line recovers $10K–$18K in annual sellable output — without any capital investment.
OxMaint runs the digital backbone of TPM: AM checklists, PM scheduling, OEE tracking with loss categorisation, Kaizen project management, and skills matrix — all on one platform.
Why TPM Programmes Fail — The Five Patterns
F1
Treated as a Maintenance Initiative
Owned by the maintenance manager, not the plant manager. Operations never engages. Autonomous Maintenance never takes hold. The programme dies quietly within 12 months.
F2
No Baseline Measurement
Without a documented OEE and Six Big Losses pareto at Day 0, no gain can be proven. Executive sponsorship erodes when the pilot cannot demonstrate impact in the first 90 days.
F3
Paper-Based Autonomous Maintenance
Operator checklists on clipboards survive 60 days. Compliance erodes silently. Mobile-first AM with photo verification and feedback loops is the only sustainable execution model.
F4
Pilot Too Big or Too Critical
Choosing the most complex bottleneck for the first pilot fails before pillars stabilise. Pick "Easiest to Improve" first — build credibility — then attack the bottleneck with a trained team.
F5
Pillars Attempted Out of Order
Quality Maintenance and Early Equipment Management need a stable AM and PM foundation. Plants that try to start with Pillar 4 or Pillar 5 produce no sustained gain and abandon TPM after a year.
TPM 4.0 — The Industry 4.0 Extensions
Modern TPM is not a replacement of the eight pillars but an enhancement. Industry 4.0 technologies make each pillar measurable in real time, predictive instead of reactive, and resilient to workforce turnover. Plants pursuing TPM 4.0 layer these on top of the classical foundation — never instead of it.
IoT Sensors
Vibration, thermal, current, and acoustic sensors replace manual rounds for non-routine conditions. Operators focus on what eyes and hands detect best.
AI Predictive Models
Failure prediction 2–12 weeks ahead converts P–F intervals into planned PM windows. Pillar 2 evolves from interval-based to condition-driven scheduling.
Mobile CMMS
AM checklists, PM execution, and Kaizen tracking on tablets and phones. Photo verification, forced compliance, and feedback loops replace paper.
Digital Twins
Equipment models support Pillar 5 — Early Equipment Management — by simulating maintainability before procurement decisions are committed.
Computer Vision
Real-time defect detection links Pillar 4 Quality Maintenance to product outcomes — closing the loop from machine condition to scrap rate.
Knowledge Capture AI
Generative AI captures retiring expertise into searchable troubleshooting guides — answering Pillar 6 in the face of a 40% workforce retirement wave.
Frequently Asked Questions
How long does a full TPM implementation actually take?
A single-line pilot delivering measurable OEE gains takes 3–4 months. Full plant rollout to mature TPM typically runs 18–36 months, with sustained world-class OEE achieved between months 18 and 24.
Book a demo to scope your roadmap.
Which pillar should we start with — Autonomous or Planned Maintenance?
Both — in parallel. AM builds operator ownership and catches deterioration; PM ensures technical work is scheduled. Skipping either leaves the other ineffective. Pillars 3 onwards are added once these two are stable, typically months 4–6.
Can TPM work in small or mid-sized manufacturing plants?
Yes. The methodology scales down cleanly because the principles — operator ownership, planned maintenance, loss elimination — are size-independent. A 20-person plant can run a structured TPM programme using the same eight pillars and a single-line pilot.
Start a free trial to begin.
What is the difference between TPM and TQM?
TPM targets equipment effectiveness through the eight pillars and OEE. TQM targets product and process quality through Six Sigma and statistical process control. They are complementary — TPM's Pillar 4 (Quality Maintenance) is precisely the bridge where the two systems intersect.
What OEE should we expect after the first 90 days?
Plants starting at 45–55% OEE typically gain 5–15 points in the first 90-day pilot through restoration cleaning, AM rollout, and the first focused-improvement Kaizen. Reaching 80%+ requires 12–24 months of structured pillar maturation.
How does CMMS support TPM execution?
A CMMS digitises every pillar — AM checklists, PM scheduling, OEE tracking with Six Losses categorisation, Kaizen project management, training records, and safety observations — on a single platform.
Book a demo to see TPM execution in OxMaint.
START YOUR TPM JOURNEY
The Plants Running World-Class OEE Did Not Buy Better Machines. They Implemented TPM Properly.
Eight pillars. Six losses. Zero shortcuts. OxMaint provides the digital backbone — autonomous maintenance checklists, planned PM scheduling, OEE dashboards with loss categorisation, Kaizen project tracking, skills matrix, and the audit trail that proves the gain. Start the 90-day pilot the right way.