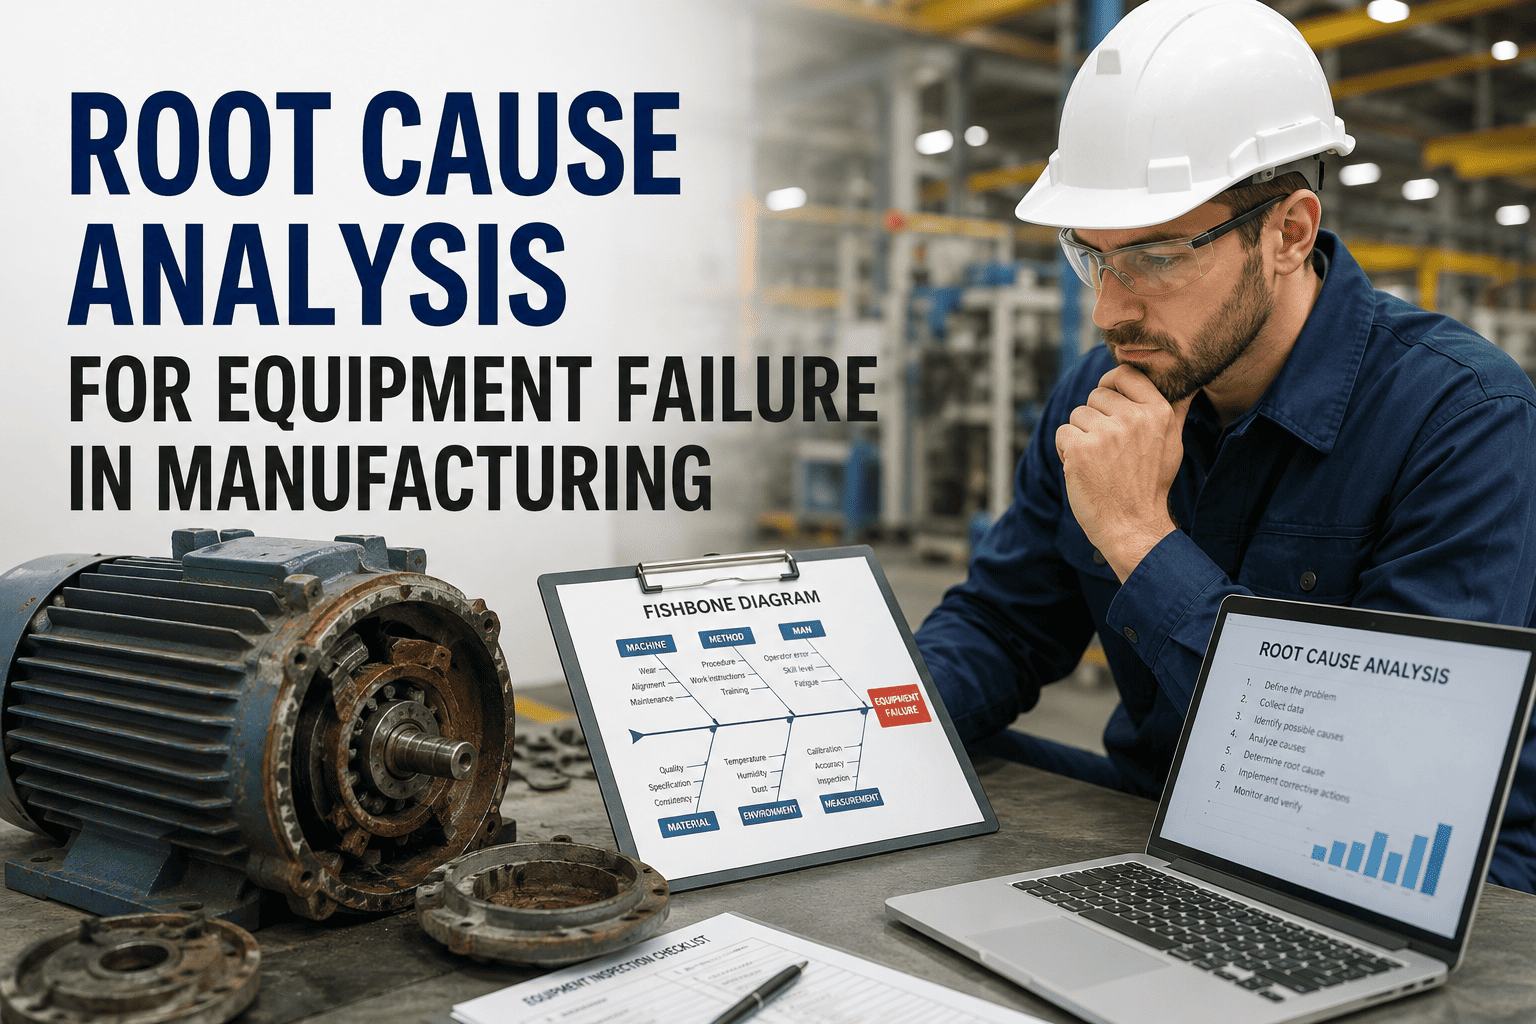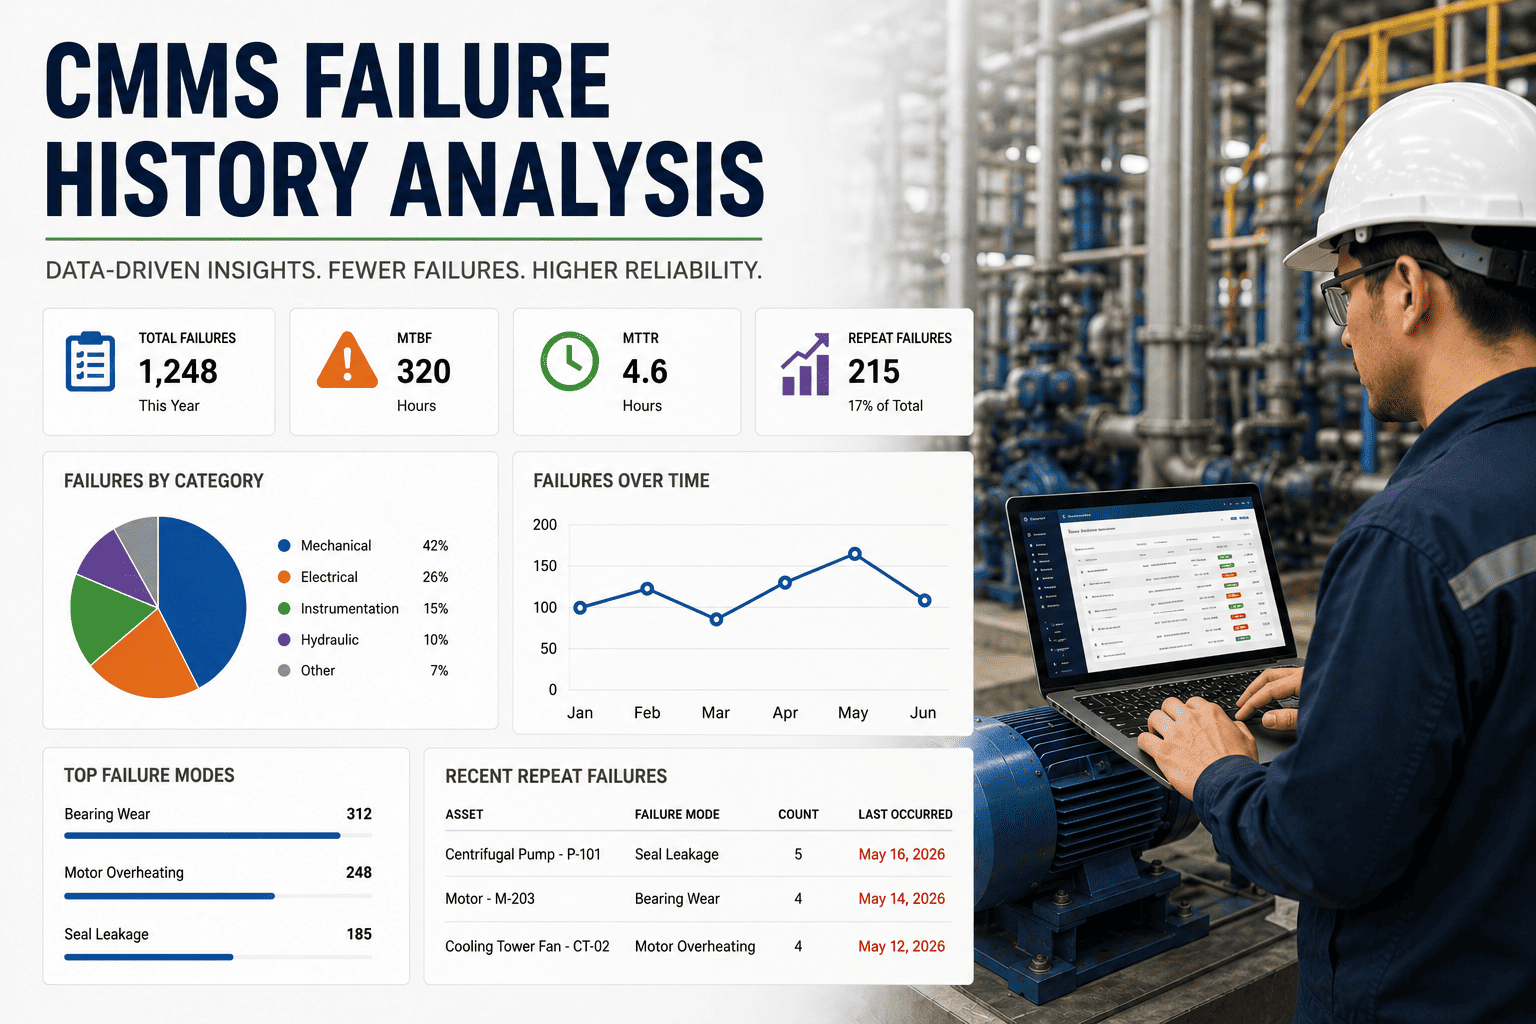
Most manufacturing plants log five to seven years of work-order history inside their CMMS and never query it for strategic insight. That archive is the single richest source of reliability intelligence on site: it tells you which assets keep failing, which failure modes dominate, how long components actually live, and where your maintenance dollars leak away. This guide walks through a complete CMMS failure history analysis playbook — bad actor lists, failure-code Pareto, MTBF by asset, and cost-per-failure reports — that turns dormant records into a prioritized reliability backlog. You can put it into practice this week by spinning up Start Free Trial or walking through it with our team.
What if the answer to your downtime problem is already in your CMMS?
A typical mid-size plant logs 8,000–14,000 work orders per year. Fewer than 1 in 5 ever mines that history for patterns. The bad actors, repeating failure codes, and component life curves are sitting there — unspent.
Five lenses that turn work-order history into a reliability backlog
Run these five analyses in sequence. Each one narrows the field: from every asset on site, down to the handful of components consuming 60–80% of your repair effort and budget.
Rank assets by failure frequency, downtime hours, and repair cost
Sort the asset register by descending count of corrective work orders over the trailing 24 months. The top 10% of assets typically generate 60–70% of unplanned events. Tag those as bad actors — they become your reliability improvement backlog.
Chart which failure modes dominate, not just which assets fail
Group closed work orders by failure code (leak, overload, vibration, calibration drift, contamination). The 80/20 rule applies: usually 4–6 failure codes account for 80% of events. Attack the code with the highest frequency × cost first.
Measure real component life, not the manufacturer's estimate
Calculate Mean Time Between Failures per asset and per component class. When measured MTBF is half the OEM rated life, you have a design, operating, or PM-quality problem — not a parts problem.
Attach labor, parts, and downtime dollars to every event
Roll up technician hours, spare parts consumed, and production loss per failure event. A $180 seal that causes $9,400 in downtime is not a $180 problem — it is a $9,580 problem, and it belongs at the top of the backlog.
Match spare parts consumption to failure trends
Cross-reference parts issued against failure codes. If bearings for Pump P-204 are consumed 4× faster than identical units elsewhere, the failure is operational — misalignment, cavitation, or contamination — not random.
The four calculations that power failure history analysis
These are the formulas reliability engineers run against exported CMMS data in Excel, Power BI, or directly inside Oxmaint. Each one takes minutes to compute and reframes how you prioritize.
A pump ran 7,200 hours in the last 12 months and failed 4 times. MTBF = 1,800 hours. If the OEM rated life is 4,000 hours, your asset is performing at 45% of design reliability.
8 failures last quarter consumed 56 repair hours. MTTR = 7 hours. Compare against target — if your SLA is under 4 hours, technician response, parts availability, or diagnostics is the constraint.
A compressor line logged 6 failures costing $11,400 labor, $3,200 parts, and $54,000 lost output. Cost per failure = $11,433. Rank assets by this number, not by raw count.
The reciprocal of MTBF. Use it to compare reliability across assets of different duty cycles — a 24/7 unit and a 12/5 unit on the same metric. Lower is better.
A 180-asset plant spending $42K a year on repeat failures
Consider a food-packaging plant running 180 critical assets. Maintenance pulled 36 months of CMMS history and ran the five-lens analysis. The pattern was embarrassingly clear — and fixable in one quarter.
| Asset | Failures (36 mo) | Downtime (hrs) | Repair Cost | Downtime Cost | Top Failure Code |
|---|---|---|---|---|---|
| Filler F-102 | 14 | 168 | $8,400 | $50,400 | Seal leak |
| Conveyor CV-08 | 11 | 94 | $5,100 | $28,200 | Belt mis-track |
| Chiller CH-03 | 9 | 132 | $11,800 | $39,600 | Refrigerant leak |
| Pump P-204 | 8 | 71 | $4,200 | $21,300 | Bearing failure |
| Mixer MX-07 | 6 | 48 | $3,600 | $14,400 | Overload trip |
Stop logging failures you've already paid to understand.
Oxmaint imports your CMMS history and auto-generates the bad actor list, failure Pareto, and cost-per-failure report on day one. Most plants surface their top 5 bad actors inside 30 minutes.
Turn the analysis into a prioritized reliability improvement plan
Analysis without action is shelf-ware. Convert every finding into a ranked backlog row using a simple ICE scoring model — Impact, Confidence, Ease — and assign each a reliability engineer, due date, and expected MTBF uplift.
| # | Action Item | Asset / Code | Impact | Confidence | Ease | Owner |
|---|---|---|---|---|---|---|
| 1 | Redesign seal spec + add condition-based vibration PM | F-102 / Seal leak | 9 | 8 | 6 | Rel. Eng. |
| 2 | Realign conveyor track + install auto-tensioner | CV-08 / Mis-track | 7 | 9 | 7 | Mech. Lead |
| 3 | Leak-test protocol + ultrasonic inspection PM | CH-03 / Refrig. leak | 8 | 7 | 5 | Rel. Eng. |
| 4 | Laser alignment + bearing housing upgrade | P-204 / Bearing | 7 | 8 | 6 | Mech. Lead |
| 5 | Motor sizing review + soft-start retrofit | MX-07 / Overload | 6 | 7 | 4 | Elect. Eng. |
Score every item 1–10 on Impact, Confidence, and Ease. Sort by the product of the three. The top 3 should always be in flight; the next 3 queued. Anything below a score of 120 goes into a quarterly review bucket.
After each fix ships, re-run the same CMMS query 90 days later. Did failure frequency drop? Did MTBF climb toward the OEM rated life? If not, the root cause was wrong — log it and re-analyze. History tells you whether the fix worked.
Plants that mined their history saw measurable reliability lifts
"We had six years of Maximo data and never ran a single Pareto. The first bad-actor report showed us three assets eating 40% of our downtime. Fixed the root cause on all three in one quarter — unplanned downtime dropped 34% the next two quarters."
"The cost-per-failure report changed the conversation with finance. Once we showed that a $200 bearing caused $11,000 in lost output, nobody argued about spending $3,500 on a condition monitoring sensor for that line."
CMMS failure history analysis, answered
How much CMMS history do I need before the analysis is meaningful?
At least 18–24 months of closed corrective work orders with consistent failure coding. Below 12 months, seasonal and load-cycle patterns wash out. Below 6 months, MTBF calculations are statistically weak — you need roughly 5–7 failure events per asset before the mean stabilizes. If your coding discipline has been inconsistent, spend two weeks recoding the top 20 assets before running the analysis.
What if our failure codes are messy or inconsistently applied?
This is the single biggest blocker — and it's fixable. Map your existing free-text failure descriptions to a standardized 12–15 code taxonomy (leak, overload, vibration, contamination, calibration, wear, electrical, software, etc.). Run a one-time cleanup script on the last 24 months of records, then enforce the taxonomy on new work orders. Oxmaint can auto-classify free-text descriptions — Book a Demo to see it on your own data.
Which assets should I analyze first?
Start with your criticality-ranked A-tier assets — the ones whose failure stops production or creates a safety event. Pull their failure history, run the bad-actor and Pareto analyses, and generate the cost-per-failure report. A 180-asset plant usually has 25–40 A-tier assets. Analyzing those first delivers 70–80% of the available value for 20% of the effort.
Can I do this in Excel, or do I need a dedicated tool?
Excel handles the math — Pareto charts, MTBF, cost rollups — for plants under ~500 assets. Export work orders, build pivot tables, and you'll have a bad-actor list in an afternoon. The friction is refresh: re-exporting and re-pivoting every month is where teams stall. A tool like Oxmaint automates the refresh, standardizes failure coding, and surfaces drift the week it happens. Start Free Trial to see the difference on your data.
How often should we re-run the failure history analysis?
Refresh the bad-actor list and Pareto monthly. Recalculate MTBF and cost-per-failure quarterly so you have enough new events for the numbers to move. Review the reliability improvement backlog every two weeks — same cadence as your PM review. The closed-loop check (did the fix actually change the failure pattern?) happens 90 days after each root-cause fix ships.
Mine your CMMS this week, not next quarter.
Import your work-order history, auto-generate the bad-actor list and failure Pareto, and ship your first three reliability fixes within 30 days. Most plants find their top bad actor in the first session.
Free 14-day trial · No credit card