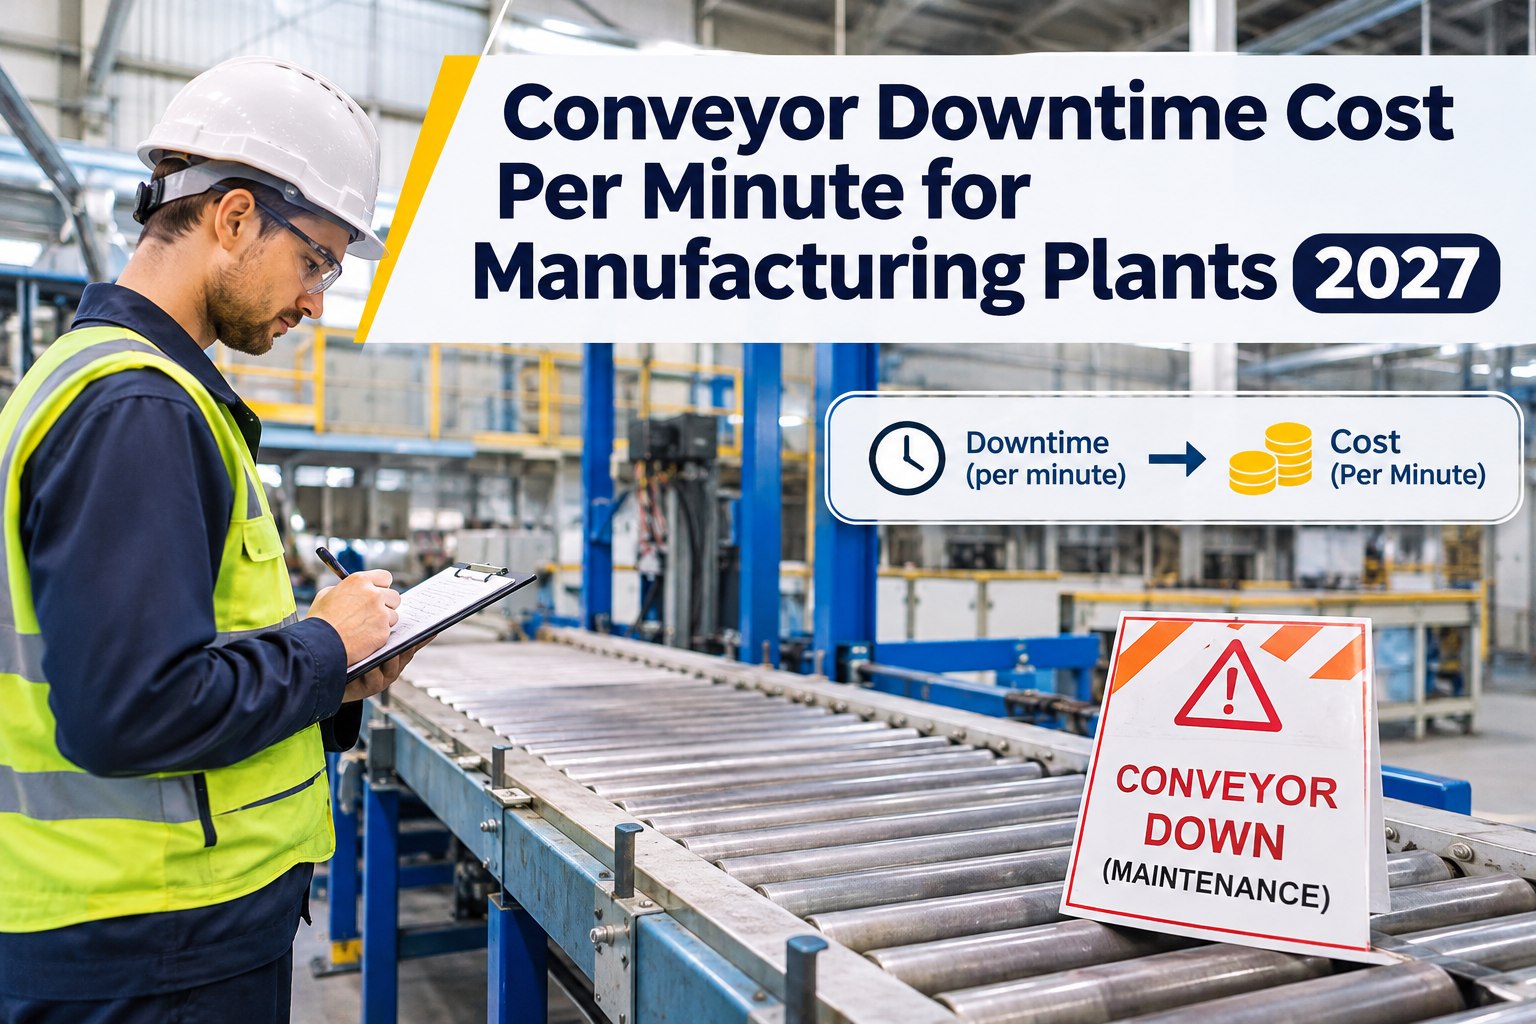
A conveyor stops for 20 minutes. Is that 20 minutes of a technician's time, or the orders that never ship, the crew waiting downstream and the restart scrap? This 2027 guide shows how to calculate an honest conveyor downtime cost per minute for your plant, without counting the same loss twice.
Conveyor Downtime Cost Per Minute for Manufacturing Plants 2027
A belt stops. Downstream stations starve, upstream stations jam, and your shipment schedule slips. Learn to price every lost minute below, or sign in now to see downtime, MTTR and repair costs live in a sample plant with the data already loaded.
These headline figures come from very large operations. Your conveyor's real number could be $15 or $1,500 a minute. Only your own line data will tell you.
Why "industry average" downtime costs don't fit your plant
Search "cost of downtime" and you'll find figures from $200 to $22,000 a minute. They aren't wrong, but they describe other plants. Two conveyors in the same building can differ 50 times over. One feeds a bottleneck with no buffer. The other runs a packaging lane that catches up by lunch. Want to see how a real asset register separates the two? Sign In to Access Micro App and browse a sample plant's conveyors, criticality and health scores.
One stopped belt, five affected stations
A conveyor rarely fails alone. It connects machines, so its downtime spreads both ways along the line:
In the micro app: a stopped machine appears under Assets down ("costing production now"), and assets whose failure halts the line can be flagged High criticality ("failure stops the line"). That makes it quick to see which conveyors are the bottlenecks worth costing first. Sign In to Try Micro App to see it in a live sample plant.
The conveyor downtime cost formula
Cost per minute = Event cost ÷ minutes stopped. Agree on a recovery window (end of shift, end of week) with finance before you calculate, and only count margin on output that customers were actually waiting for.
Worked example: a 20-minute stop on a bottleneck line
- Lost contribution 79%
- Expedited freight 10%
- Overtime premium 6%
- Restart scrap 4%
Illustrative numbers, not a benchmark. Notice that the repair itself (parts and planned technician time) is a small share. Lost throughput is almost always the biggest cost.
Conveyor downtime calculator: try your numbers
Pre-filled with the worked example above. Swap in one real event from last month.
The Downtime logged KPI: hours equipment was out of service (Dashboard & KPIs)
Cost booked on the work order, plus Labour hours and cost per technician or contractor
Work orders for that conveyor in Reports, filtered by machine and date
Your production system and finance team. These don't come from the maintenance app.
Same formula, very different answers
Here are three typical conveyor applications run through the same math. All figures are illustrative:
What this means: rank conveyors by cost per minute, not by how often they fail. A belt that stops monthly on a bottleneck can cost more than one that hiccups daily on a buffered lane. Get Started with Micro App to rank your own assets by criticality.
5 mistakes that inflate (or hide) downtime cost
Multiplying lost units by the selling price
Use contribution margin. Materials you didn't consume aren't a loss.
Adding a cost for every starved station
Measure the final good-output shortfall once
Counting salaried crew waiting as new cash cost
Count only overtime, temp labor or premiums the stop caused
Ignoring restart scrap and quality holds
Log extra scrap and rework above your normal rate
Treating delayed shipments as lost revenue
Report delay, recovery and permanent loss separately
From a jammed belt to a fixed cause, in one portal
The formula only works with real data: how often each conveyor stops, for how long and why. Here's how the Oxmaint micro app captures that, step by step.
"Belt Conveyor 01 stopped with a carton jammed at the transfer and the drive tripped. Cleared once, jammed again 23 min later."
Shown: the ready-made sample plant that loads with the micro app, so every screen has data to explore from day one.
Where each cost input lives in the micro app
Downtime logged KPI: hours each machine was out of service
High criticality assets ("failure stops the line") and Assets down ("costing production now")
Labour hours and cost per technician and contractor, plus cost booked on each work order
Breakdown share KPI and the Reliability tab in Reports, exportable to CSV or PDF
Don't just read about it. Click through it. Sign in to explore QR requests, work orders, PM schedules and downtime KPIs in a ready-made sample plant. Moving from Limble CMMS? Send your export and the team loads your data for you.
Where conveyor minutes usually go and how to win them back
Often caused by buildup on pulleys, off-center loading or seized idlers. Fix: a recurring "conveyor chain, belt and drive inspection" PM schedule.
A seized roller drags the belt and can steer it off-track. Fix: keep bearings above minimum stock. Demand Parts flags shortfalls so you can raise a PO.
An out-of-square or worn splice can turn into a sudden tear. Fix: an inspection checklist with photos, and belt lacing kits kept in stock.
Gearbox, coupling and motor issues cause long stops. Fix: PMs on running hours, e.g. "every 500 hours or 1 month, whichever comes first."
Photo-eyes, misfeeds and transfer points cause frequent micro-stops. Fix: operators report every stop by scanning the plant QR, even 2-minute jams.
Waiting for a technician, a part or approval adds the most avoidable minutes. Fix: Parts Readiness shows which jobs the shelf can cover before anyone walks out.
For a deeper preventive plan, see our conveyor maintenance guide for material handling systems, or Explore the Micro App to set up a conveyor PM schedule on running hours or calendar.
The payback math: what 10 saved minutes are worth
Cutting just 10 minutes a week off one bottleneck conveyor through faster response, better PM timing or fewer repeat faults recovers almost $100K a year in this example. Multiply that across every belt in your plant.
Frequently asked questions
How do I calculate conveyor downtime cost per minute?
Multiply units per minute by minutes stopped, subtract units recovered later, multiply by contribution margin per unit, and add incremental costs such as overtime, scrap and expediting. Divide the total by minutes stopped.
What is a typical conveyor downtime cost per minute?
There is no reliable universal figure. Depending on line rate, margin and buffers, it can range from under $20 to well over $1,000 a minute. Calculate it per conveyor using your own data.
Should starved and blocked stations be added to the cost?
Only their net effect. They show how the stop spreads, but the lost output is measured once at the end of the line. Add separate costs only for real incremental spend, like idle temp labor.
Is OEE the same as downtime cost?
No. OEE measures availability, performance and quality as percentages. Downtime cost converts the unrecovered loss into money. Use OEE to find losses and the cost formula to prioritize them.
How can I reduce conveyor downtime?
Log every stop with asset, cause and duration. Rank conveyors by cost per minute, set PM tasks against the top failure modes, and shorten response time by checking parts availability before the job starts.
Can the Oxmaint micro app track conveyor downtime?
Yes. Operators report problems by scanning a plant QR code with any phone, and requests become work orders. The KPI view counts downtime logged, MTTR, breakdown share and maintenance spend. PM schedules can run on hours, calendar or both. Use those figures as inputs to the cost formula above. Sign In to the Micro App to explore it with sample data.