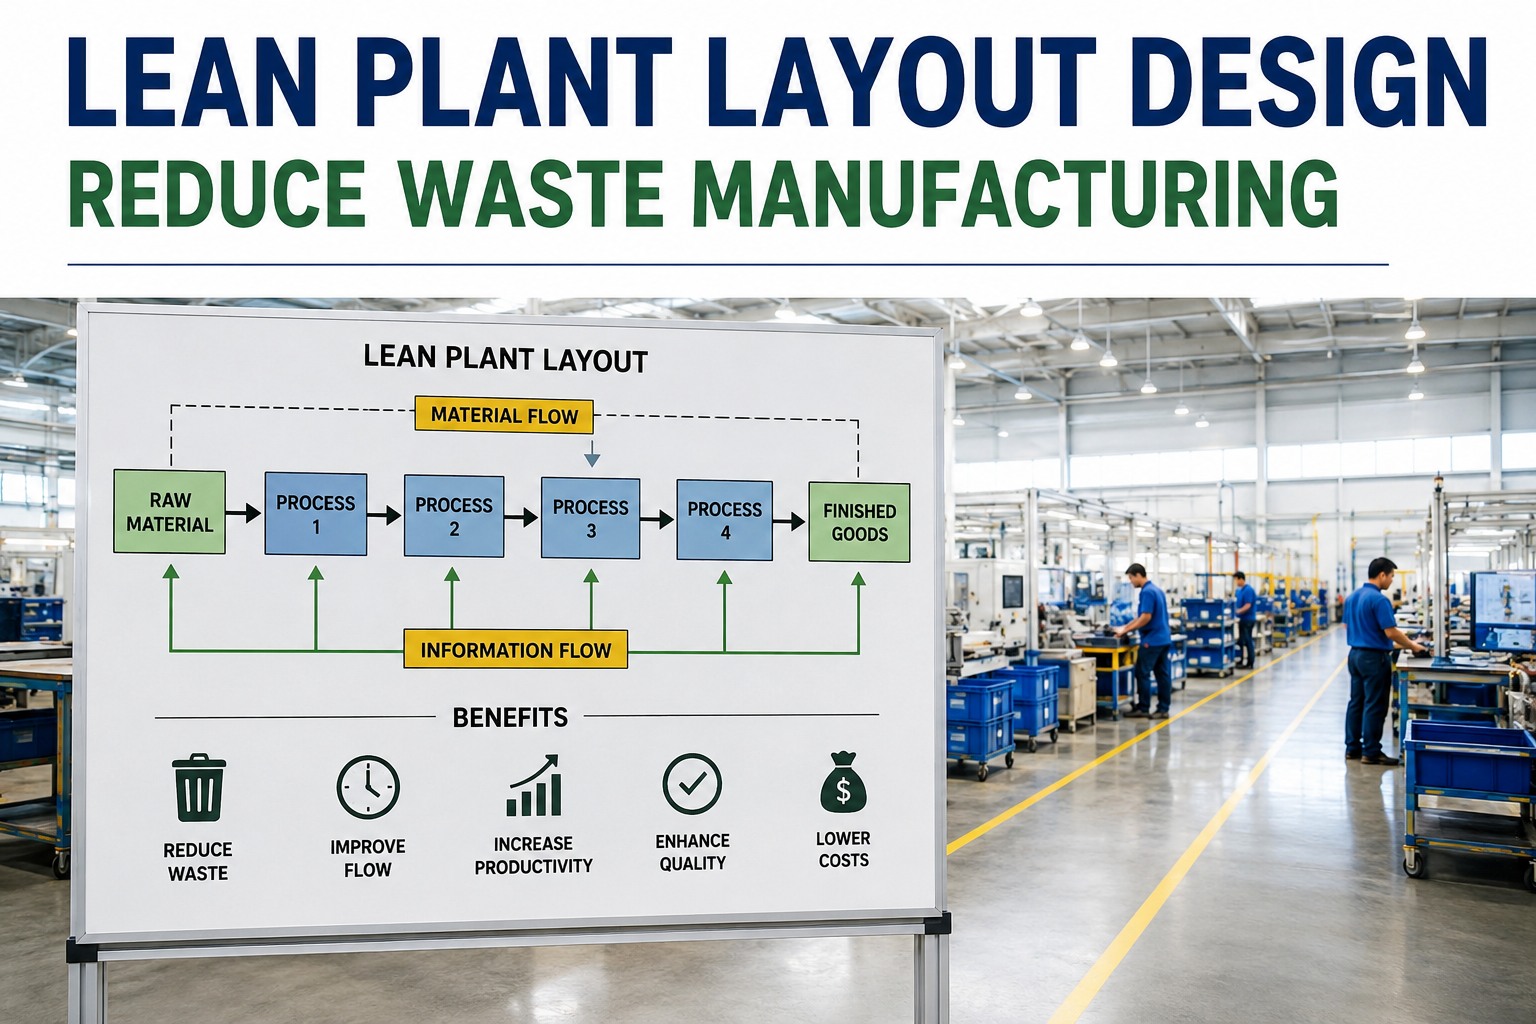
A spaghetti diagram is the simplest, fastest way to expose material handling waste hiding in your manufacturing plant — and it shocks almost every team that draws one honestly. By tracing the actual path of materials, tools, and operators on a floor plan, a spaghetti chart reveals the excessive motion, backtracking, and transportation waste lean manufacturing targets for elimination. Industrial engineers use this visual lean tool to calculate total travel distance, identify crowded aisles, and redesign plant layouts so that material flow is continuous rather than chaotic. When you combine these physical layout improvements with a modern CMMS like OxMaint, you can track the maintenance impact of new equipment placements and keep optimized lines running longer — Start Free Trial to see how integrated work-order tracking anchors your lean flow improvements.
How much walking is your plant paying for every shift?
A single spaghetti diagram often exposes 2–5 miles of wasted motion per operator, per shift. Map it once, quantify the material flow waste, and redesign the route to slash handling time and transportation waste.
What is a spaghetti diagram in lean manufacturing?
A spaghetti diagram — sometimes called a spaghetti chart or spaghetti map — is a visual lean manufacturing tool used to track the movement of materials, work-in-process, and personnel across a facility. Industrial engineers draw continuous lines on a scaled floor plan to represent every trip an operator or part makes during a production cycle. The result looks like a tangled plate of spaghetti, and the density of those lines instantly reveals motion waste manufacturing teams need to eliminate.
Continuous Flow Lines
Each line represents an actual trip. Thicker clusters show high-traffic intersections and bottlenecks causing handling waste.
Distance Measurement
Engineers use a map wheel or digital measuring tool to calculate total feet traveled per shift, turning visual clutter into hard data.
Waste Identification
The chart exposes the seven wastes of lean, specifically motion and transportation waste, guiding targeted layout redesigns.
How to create a spaghetti diagram to reduce material handling
Creating an effective spaghetti map requires honest observation, not assumptions. Follow this four-step methodology to accurately map material movement waste and build a business case for layout changes that actually get funded.
Document the Current State
Obtain or draw a scaled floor plan of the work cell or plant. Mark the exact locations of machines, workstations, staging areas, and storage racks. Define the specific process or product family you are tracking before observation begins.
Trace the Actual Movement
Stand on the floor and trace the operator's exact path with a colored pen. Use different colors for materials versus operators. Record at least 5–10 full production cycles to ensure your spaghetti chart captures variation in the work flow.
Quantify the Distance and Time
Measure the total length of the lines. Multiply the distance per cycle by daily demand to find total daily travel. Time how long the operator spends walking—this is your baseline for handling time reduction ROI calculations.
Redesign the Lean Material Flow
Rearrange equipment, relocate tooling, or introduce point-of-use storage to straighten the lines. The goal is to transform the spaghetti chart into a smooth, unidirectional U-cell or straight-line flow that minimizes backtracking.
Calculating material handling waste reduction ROI
To get a layout redesign approved, you must translate the spaghetti diagram into financial terms. A 180-asset plant spending $42K annually on material handling labor can use a simple formula to project savings from a lean flow re-layout.
Worked Example: 180-Asset CNC Machining Plant
A plant producing 200 units per day observes operators walking 4.5 minutes per cycle to retrieve tooling and staging materials. After drawing a spaghetti map, industrial engineers relocate tooling racks and implement point-of-use kanbans, cutting walking time to 1.5 minutes per cycle.
Spaghetti diagrams and transportation waste in lean
Lean manufacturing identifies seven core wastes (muda). A spaghetti diagram directly targets two of the most overlooked wastes: motion and transportation. Understanding the difference is critical for plant motion analysis and achieving lean material flow.
| Waste Type | Definition | How Spaghetti Maps Expose It |
|---|---|---|
| Motion Waste | Operator movement that does not add value (reaching, walking, bending). | Shows excessive lines between a workstation and tools or parts bins. |
| Transportation Waste | Movement of materials or WIP between distant processes. | Reveals long lines crossing the plant floor between functional silos. |
| Waiting (Delay) | Idle time when operators wait for materials or equipment. | Highlights trips to staging areas that are chronically empty or delayed. |
| Overprocessing | Doing more work to a part than the customer requires. | Uncovers redundant back-and-forth trips to inspection or rework stations. |
How OxMaint sustains lean material flow improvements
Redesigning your layout to reduce material handling is only half the battle — you must sustain the new flow. OxMaint bridges the gap between lean physical design and digital reliability, ensuring your optimized work cells stay running, tooling stays available, and spare parts are always at point-of-use.
Point-of-Use Inventory Tracking
Keep spare parts and tooling at the newly optimized workstation. OxMaint tracks bin levels and triggers auto-replenishment so operators never leave their cell to hunt for missing components, eliminating the motion waste you just designed out.
Predictive Maintenance for Layout Assets
When you consolidate equipment into a U-cell, a single machine failure stops the whole line. OxMaint uses AI-driven vibration and temperature analytics to predict failures before they happen, protecting your continuous flow from unplanned downtime.
Mobile Work Orders
Technicians receive work orders directly on their mobile devices at the point of need. No more walking to a central office to pick up paper routes — OxMaint digitizes the flow of maintenance information just like you digitized your material flow.
Maintenance Analytics Dashboards
Track the OEE and uptime of your redesigned cells in real-time. OxMaint analytics prove the ROI of your spaghetti diagram project to leadership, showing exactly how much handling time and downtime was reduced post-implementation.
See OxMaint on your assets — book a 30-min demo
Discover how AI-powered maintenance analytics and work-order automation can lock in your lean material flow gains and cut unplanned downtime by 30–50%.
Spaghetti diagram FAQs
What is the main purpose of a spaghetti diagram?
The main purpose of a spaghetti diagram is to visually expose the wasted motion and transportation in a process. By drawing the actual paths operators and materials take, it highlights unnecessary walking, backtracking, and layout inefficiencies so teams can redesign the floor plan for lean material flow.
What is the difference between a spaghetti chart and a value stream map?
A spaghetti chart focuses specifically on the physical movement and distance traveled by people and materials within a single work cell or department. A value stream map (VSM) is broader, tracking the entire flow of information and materials across the whole supply chain from raw material to customer delivery.
How do you calculate motion waste from a spaghetti map?
To calculate motion waste, measure the total length of the lines on your spaghetti map using a map wheel or CAD software. Multiply the distance per cycle by the number of cycles per shift to find total daily travel. To monetize it, multiply the wasted walking time by the operator's loaded labor rate. You can Book a Demo to see how OxMaint tracks these downtime metrics digitally.
When should a manufacturing plant use a spaghetti diagram?
A plant should use a spaghetti diagram during a kaizen event, before a facility layout redesign, or whenever excessive operator walking and material handling costs are suspected. It is especially useful when converting from a functional, batch-and-queue layout to a continuous, one-piece flow cellular layout.
Can a CMMS help reduce material handling waste?
Yes. While a CMMS does not draw the physical layout, it ensures the new lean flow is sustainable. By tracking spare parts inventory at point-of-use and dispatching mobile work orders, a platform like OxMaint prevents operators and technicians from leaving their cells to find tools or report issues, directly supporting handling waste reduction.
Eliminate motion waste and digitize your maintenance operations
Stop relying on paper routes and guesswork. OxMaint gives you the AI-powered work orders, asset tracking, and inventory control you need to keep your lean plant running at peak efficiency.
Free 14-day trial · No credit card