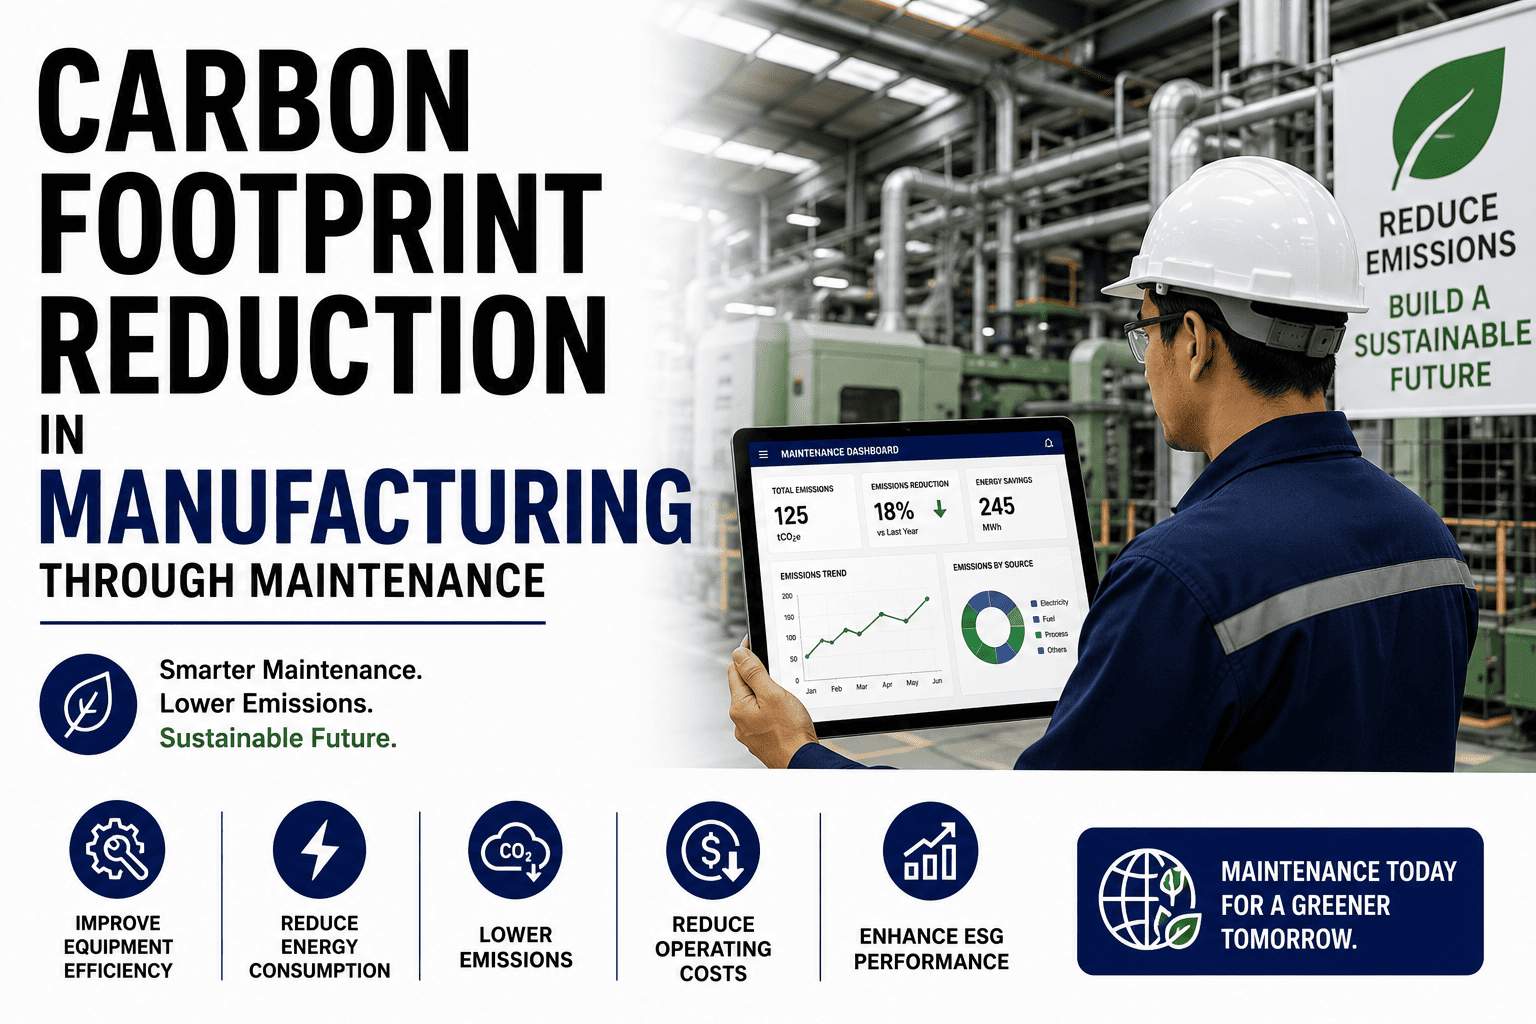
A maintenance event is an emissions event. When a motor loses alignment, a compressor develops leaks, or a chiller fouls its tubes, the asset does not just cost more to run — it burns more energy to do the same work, and that extra energy is extra carbon that lands in the plant's sustainability report whether anyone is tracking it or not. This is the fact that turns maintenance into the operational engine of a sustainability programme rather than a cost centre sitting beside it. Poorly maintained equipment consumes 15 to 30% more energy than well-maintained equivalents, and in a manufacturing plant energy is not a footnote to the carbon footprint — motors, compressors, refrigeration, and HVAC are the footprint, sitting squarely inside Scope 1 and Scope 2. So every degraded asset is a rising emission, and every restored one is a reduction booked. The maintenance log, kept properly, is the sustainability ledger. This guide covers how manufacturing plants use maintenance to actually hit sustainability targets: energy monitoring, leak elimination, carbon tracking, and CMMS-based green operations. Start a free Oxmaint trial and baseline energy performance across the asset portfolio, or book a demo to see energy-triggered work orders and ESG reporting.
Manufacturing · Maintenance Strategy · Sustainability
Green Manufacturing Maintenance & Sustainability with CMMS
How manufacturing plants turn maintenance into their sustainability engine — energy monitoring, leak elimination, carbon tracking, and CMMS-based green operations that put ESG targets where they are actually won or lost.
-
15–30%
more energy consumed by poorly maintained equipment
-
25–30%
of industrial facility electricity is drawn by motors
-
3–6 mo
to measurable energy cost reduction from structured PM
-
30%
less maintenance waste under condition-based intervention
A Degrading Asset Is a Rising Emission
Where the Wasted Energy Actually Hides
Most controllable energy waste in a plant concentrates in a few asset classes, and every failure mode below is preventable with scheduled maintenance. The percentages are the point: each is an efficiency loss that a work order reverses.
- Motors 25–30% of plant electricity The single largest electrical load in most facilities. Misalignment, bearing wear, and lubrication faults quietly raise draw — and alignment correction is one of the fastest-returning energy interventions available.
- Compressed air leaks waste a third The most expensive utility in the plant, and a quarter to a third of it escapes through leaks before doing work. Leak elimination is the highest-return single action in most energy programmes.
- HVAC & refrigeration up to 21% from dirty coils Dirty coils cut efficiency ~21%, clogged filters add ~15% consumption, and a refrigerant leak makes compressors work ~20% harder. Every one reverses with a filter change, a coil clean, or a charge correction.
- Lubrication & consumables 40–60% longer life Oil analysis extends lubricant lifecycles 40–60%, cutting both cost and the disposal footprint. Condition-based intervention reduces overall maintenance waste by up to 30% versus fixed-interval replacement.
Well-maintained equipment operates at peak efficiency, and predictive maintenance typically cuts energy consumption 10–20% against a reactive baseline. Book a demo to see energy waste ranked by asset across the plant.
From Work Order to Carbon Number
How a Missed PM Becomes a Reported Emission
The link between the maintenance floor and the ESG report is not abstract — it is a direct, traceable chain. Follow it and it becomes clear why the emission shows up whether or not anyone is measuring it.
-
1
Efficiency degrades on an asset
A compressor fouls, a motor drifts out of alignment, a coil clogs. The machine still runs and still makes product, so operations sees no reason to act. -
2
Energy draw per unit of output rises
The asset now consumes 15–30% more for the same work. Its energy signature has changed, and a CMMS watching consumption per asset can see the anomaly before anyone feels it. -
3
Extra energy becomes extra carbon
Purchased electricity is Scope 2; on-site combustion is Scope 1. The degradation converts directly into emissions per unit produced — a rising carbon intensity nobody chose. -
4
It lands in the ESG report
The increase appears in the emissions figure regardless of whether it was tracked — so the only choice is whether it was seen and prevented, or discovered after the reporting period closed.
Energy-triggered work orders close the loop — when an asset's draw signals declining efficiency, the CMMS raises the job before the carbon accrues. Sign up for Oxmaint to trigger work orders on energy anomalies.
The Maintenance Log as Carbon Ledger
What Maintenance Data Feeds in Each Scope
Asset-level maintenance data maps directly onto the greenhouse gas scopes and the disclosure frameworks built on them. Captured as a normal part of the work order, it becomes the audit evidence a report requires.
| Scope | Assets | Maintenance Data Captured |
|---|---|---|
| Scope 1 direct | Boilers, gas ovens, forklifts | Combustion efficiency, heat-rate degradation |
| Scope 2 purchased | Motors, compressors, HVAC, refrigeration | Energy draw per asset vs design baseline |
| Scope 3 selected | Spare parts, contractor travel | Embodied carbon of parts, service trips |
| Waste (GRI 306) | Lubricants, filters, seals, gearboxes | Waste type, volume, disposal route per task |
| ISO 50001 / 14001 | Whole portfolio | Energy trend and efficiency-action evidence |
Motor efficiency degradation tracked across PM intervals even generates predictive carbon trajectory — showing which assets are trending toward higher emissions before the next reporting period. Book a demo to see maintenance data structured for GRI, SASB, and TCFD.
Fewer Replacements Is a Green Metric
Extending Asset Life Defers a Manufacturing Footprint
The greenest asset is the one you did not have to buy. Every motor, gearbox, and pump replaced early carries the embodied carbon of its manufacture and the disposal burden of the unit it replaced — so extending useful life through predictive maintenance is a direct emissions reduction, not just a cost saving. Condition-based maintenance eliminates unnecessary interventions and premature part replacement, reducing maintenance waste by up to 30% while stretching consumable and component life, and oil analysis alone extends lubricant life 40 to 60%. This is the circular-economy case that lives inside the maintenance department: rebuilt-component tracking, consumable replacement justified by sensor data rather than the calendar, and hazardous fluids logged to a compliant disposal route. The result is an asset base that lasts longer, wastes less, and books its sustainability gains as a by-product of ordinary reliability work — with the ROI, including extended equipment life, typically materializing within 12 to 18 months.
Oxmaint for Green Manufacturing
How Oxmaint Runs Sustainable Maintenance
-
Energy Baseline
Consumption per Asset
Capture asset-level energy data and hold a design baseline per machine, so consumption anomalies are linked to maintenance condition and the biggest energy wasters surface for targeted intervention.
-
Energy Work Orders
Triggered by Draw
Generate energy-triggered work orders automatically when an asset's consumption signals declining efficiency — catching a fouling compressor or a drifting motor before the extra carbon accrues.
-
Leak Programme
Compressed Air by Zone
Run leak detection and repair as a tracked recurring programme — the highest-return energy action in most plants — with results logged against the distribution zone and the savings quantified.
-
Carbon Tracking
Scope 1 and Scope 2
Calculate emissions linked directly to asset operation from the energy data maintenance already collects, turning the maintenance record into the primary source for carbon accounting.
-
Waste Attribution
Logged per Work Order
Record waste type, volume, and disposal route on each task — spent oils, filters, seals, gearboxes — producing the asset-level waste attribution that GRI 306 and ISO 14001 reporting need.
-
ESG Reporting
Structured, Not Compiled
Portfolio-level reports on energy trends, efficiency improvements, and lifecycle data structured for ISO 50001, GRI, SASB, and TCFD — generated from operations rather than compiled by hand each quarter.
Frequently Asked
Green Maintenance Questions
How does maintenance actually reduce carbon emissions?
Through energy. Poorly maintained equipment consumes 15–30% more energy than well-maintained equivalents, and in a manufacturing plant that energy — drawn by motors, compressors, refrigeration, and HVAC — sits inside Scope 1 and Scope 2. When maintenance restores an asset to peak efficiency, energy consumption falls and so do emissions per unit produced. Predictive maintenance typically cuts energy use 10–20% against a reactive baseline, which is why maintenance events are effectively emissions events. Sign up for Oxmaint to link energy performance to maintenance.
Which assets waste the most energy when neglected?
A few categories dominate. Motors draw 25–30% of industrial facility electricity and lose efficiency to misalignment and bearing wear. Compressed air is the most expensive utility, with a quarter to a third lost through leaks. HVAC and refrigeration degrade fast — dirty coils cut efficiency about 21%, clogged filters add roughly 15% consumption, and a refrigerant leak makes compressors work about 20% harder. Every one of these is reversible with scheduled CMMS maintenance, which is what makes them the priority targets.
How does CMMS data support ESG and carbon reporting?
Asset-level maintenance data maps onto the greenhouse gas scopes directly: Scope 1 from combustion assets like boilers and ovens, Scope 2 from purchased electricity for motors and compressors, and selected Scope 3 from spare-part embodied carbon and contractor travel. Recording waste type and disposal route per work order adds GRI 306 waste attribution, and portfolio energy trends support ISO 50001 and ISO 14001. Captured as a normal part of maintenance, this becomes audit-ready evidence structured for GRI, SASB, and TCFD. Book a demo to see ESG reporting from maintenance data.
What is the ROI timeline for a sustainable maintenance programme?
Most facilities see measurable energy cost reductions within 3 to 6 months of implementing structured, CMMS-driven maintenance — particularly from HVAC filter and coil maintenance, compressed air leak repairs, and motor alignment corrections, which are the fastest-returning actions. The fuller ROI, including extended equipment life and reduced replacement cost, typically materializes within 12 to 18 months. Because condition-based maintenance also cuts maintenance waste by up to 30% and extends lubricant life 40–60%, the environmental and financial returns arrive together. Sign up for Oxmaint to baseline and track the savings.
Baseline · Detect · Restore · Report
The Sustainability Target Is Won on the Maintenance Floor
Every degraded motor, leaking air line, fouled coil, and prematurely scrapped gearbox is energy wasted and carbon emitted that a work order could have prevented. Oxmaint gives manufacturing teams one platform to baseline energy per asset, trigger work orders on consumption anomalies, run leak elimination as a programme, track Scope 1 and Scope 2 carbon from maintenance data, attribute waste per task, and produce ESG reports structured for the frameworks — so sustainability targets are hit through the reliability work the plant is already doing.