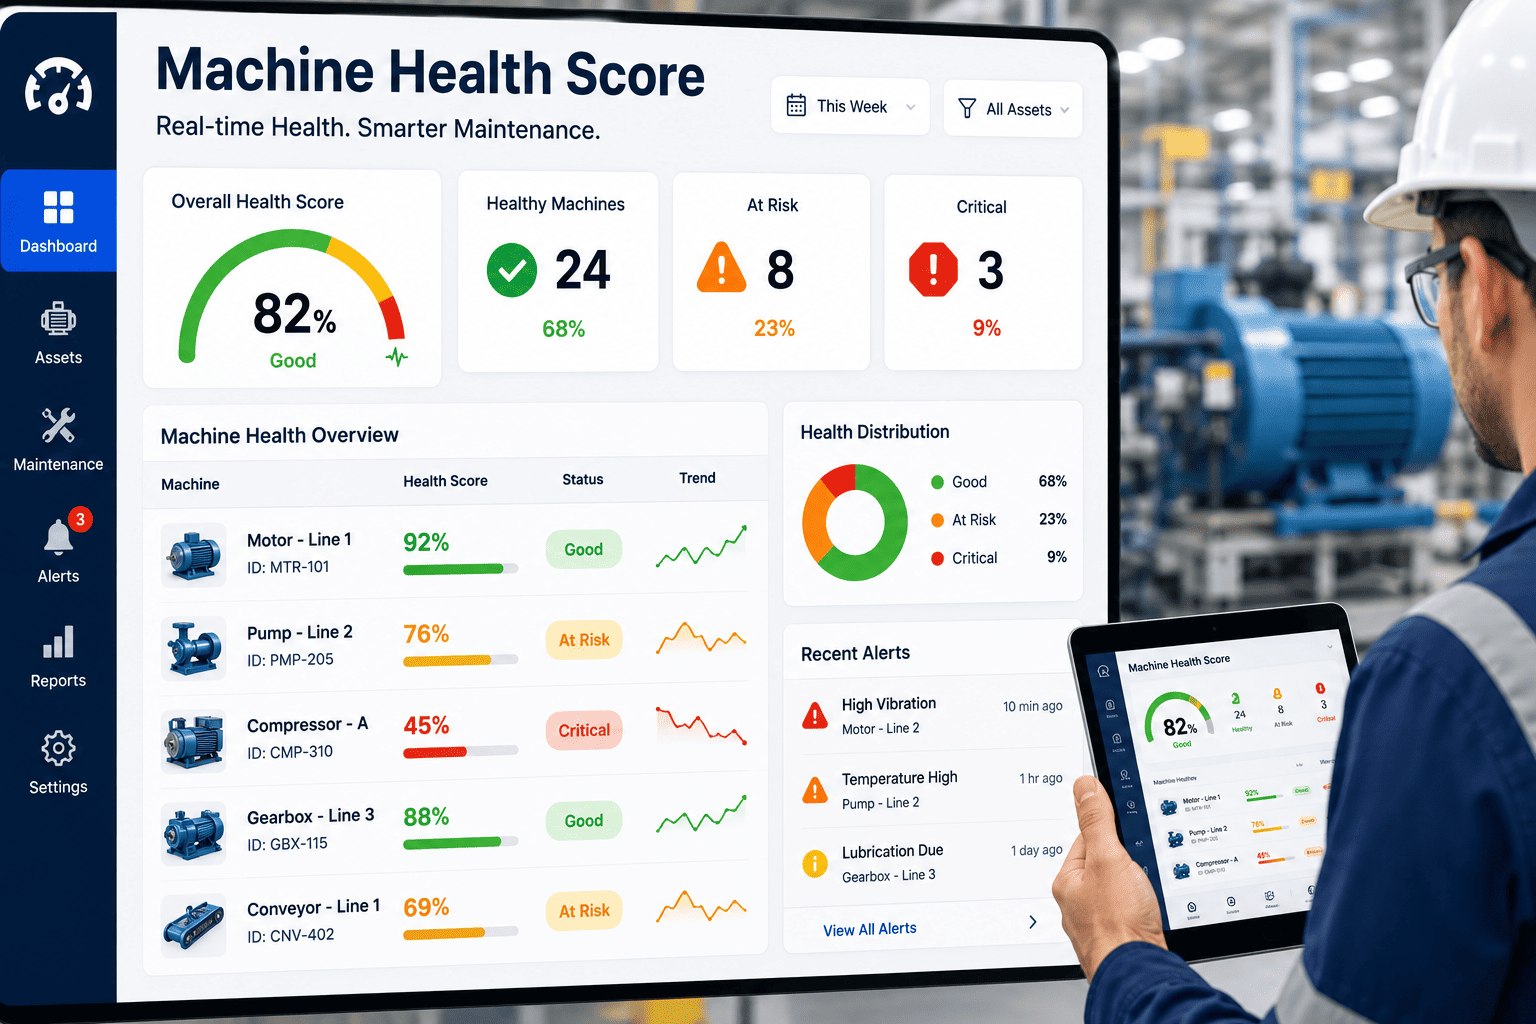
A machine health score compresses vibration, temperature, oil analysis, and process data into a single number a supervisor can act on — typically a 0–100 index that ranks every asset by risk. The problem in most plants is that condition-monitoring data lives in one system, work orders live in another, and the score itself decorates a wall display nobody opens. When the score is wired directly into your CMMS, it stops being a vanity metric and starts generating corrective work orders, prioritizing the weekly maintenance queue, and justifying parts purchases before failure. This guide shows how to design that loop — weighting rules, threshold bands, drilldown paths, and the governance that keeps the number honest. Ready to build yours? Start Free Trial and configure it inside an existing CMMS in under a day.
Machine Health Score · CMMS Integration Guide
Can a single number tell you which machine fails next — and which work order to open today?
A well-built health score turns 40+ sensor channels, oil lab results, and CMMS history into one defensible 0–100 index. Plants that operationalize it cut unplanned downtime by 25–45% within the first year and recover the deployment cost in under 9 months.
Why A Single Score
Supervisors read one number, not forty sensor channels
Reliability engineers can interpret a spectrum plot; shift supervisors and operators cannot. The score is the translation layer between condition-monitoring depth and operational action.
A 180-asset food-packaging plant spending $42,000/yr on reactive bearing replacements deployed a weighted health score across 62 critical machines. Within six months the score flagged 11 assets in the 30–50 band before failure, the CMMS auto-generated inspection work orders, and the plant avoided an estimated $128,000 in lost production and emergency parts — a payback under 5 months on a $24K software + sensor retrofit.
The Scoring Model
Four signal streams, one weighted composite
There is no universal formula — but every defensible score combines the same four families of inputs, weighted by asset criticality and failure mode. Below is the reference weighting used for a mid-criticality (ISO 55000 Tier B) rotating asset.
Vibration & dynamics
ISO 10816 velocity (mm/s RMS), bearing defect frequencies (BPFO/BPFI/BSF), envelope spectrum, and acceleration kurtosis. Trend slope over 14 days matters as much as the absolute value — a 0.8 mm/s jump in a week is a stronger signal than a steady 3.5 mm/s.
Thermal imaging & temperature
Bearing-housing RTD deltas, motor-winding thermistors, and IR-camera hotspots on couplings and gearboxes. A 15°C rise over baseline ambient at the outer race is an amber flag; 25°C is red and triggers an inspection work order regardless of vibration.
Oil analysis & tribology
PPM iron, copper, and chromium via ICP spectroscopy; ISO 4406 particle count; viscosity and water content. A single 200 ppm iron spike on a gearbox with a 50 ppm baseline halves the oil sub-score overnight and forces a resample within 7 days.
Process & CMMS history
Operating hours since last overhaul, mean-time-between-failure trend, number of open workarounds, and current OEE deviation. An asset running 18% below its OEE baseline with a degrading vibration trend is prioritized above one with a worse score but stable output.
Where each sub-score V, T, O, P is normalized 0–100 (0 = healthy baseline, 100 = failure threshold) from its raw sensor or lab value, then weighted. Asset criticality multiplies the final H by a 0.8–1.2 criticality factor so a Tier-A turbine and a Tier-C fan with identical raw scores surface differently in the queue.
Threshold Bands
Five bands turn a number into a work order
A score without an action rule is decoration. Map every band to a specific CMMS response — auto-generated work order type, SLA, and escalation path — so the supervisor never has to interpret the number.
| Band | Score | Color | CMMS action | SLA |
|---|---|---|---|---|
| Excellent | 90–100 | Green | Continue routine PM schedule | None |
| Good | 75–89 | Lime | Log trend note; review at next weekly round | 7 days |
| Watch | 60–74 | Amber | Auto-create inspection work order (WO type: PdM-Inspect) | 72 hours |
| Degraded | 40–59 | Orange | Auto-create corrective WO; pull spare parts reservation | 24 hours |
| Critical | 0–39 | Red | Escalate to reliability lead; consider planned outage | 4 hours |
Implementation Timeline
From sensor to live score in 90 days
Most plants under-estimate the data-engineering step and over-estimate the algorithm step. The plan below assumes a mid-sized plant (100–500 assets) with an existing CMMS and partial sensor coverage.
Asset criticality & data audit
Rank assets A/B/C by production impact and safety risk. Inventory every data source — vibration sensors, oil lab cadence, PLC tags, existing CMMS work-order history. Identify the 20% of assets that drive 80% of downtime cost; these get full sensor coverage first.
Baseline & weighting calibration
Collect 30 days of clean data per asset class to establish baselines. Calibrate sub-score thresholds against known historical failures — if a bearing failed at 4.2 mm/s RMS, that is your Vn=100 reference, not a textbook chart. Validate the composite against the last 12 months of work-order history.
CMMS integration & pilot
Connect the score engine to the CMMS via API so band breaches auto-create work orders with the correct type, priority, and parts list. Pilot on one production line for two weeks; tune false-positive rate to under 10% before plant-wide rollout. Train supervisors on the drilldown path.
25–45% less unplanned downtime
Catch degrading assets 7–30 days before failure instead of after.
15–30% lower MRO spend
Replace bearings on condition, not on calendar — and stop emergency freight.
2–5 pt OEE gain
Fewer surprise outages mean more nameplate-rate hours per shift.
30% shorter MTTR
Diagnosis arrives with the work order — technicians start with the cause, not a search.
Governance
Keep the score honest or lose the supervisor's trust
A score that cries wolf twice is ignored forever. Governance is what separates a maintenance tool from a dashboard nobody opens by month four.
“
If the score does not change a work order today, it is not a health score — it is a chart. The test is simple: ask any supervisor what they did differently yesterday because of the number. Blank stare means the loop is broken.
Re-baseline quarterly
Operating context shifts — new product mix, speed changes, ambient cycles. Re-fit baselines every 90 days and flag any asset whose healthy band moved more than 15 points.
Audit false positives monthly
Track how many amber/red work orders found an actual defect. Below 70% diagnostic accuracy, recalibrate thresholds. Document every recalibration so the reliability team owns the math.
Tie score to a single owner
Every asset with a live score has one named reliability engineer accountable for threshold tuning. Shared ownership means nobody recalibrates — and the number drifts.
Publish the math
Supervisors trust a score they can audit. Show the sub-scores, the weights, and the last three threshold changes inside the CMMS drilldown — not a black-box integer.
Turn The Score Into Work Orders
Stop decorating dashboards. Start driving maintenance.
Configure a weighted machine health score inside your CMMS and watch band breaches auto-generate the right work order — parts, priority, and technician included.
FAQ
Machine health score — what plants ask first
How many data sources do I need before the score is useful?
You can start with vibration plus CMMS work-order history on your top 20% of critical assets — that alone produces a defensible score for rotating equipment. Oil analysis and thermal inputs add 15–25 points of early-warning lead time, so layer them in month two. The score becomes misleading only when you weight a sub-score you cannot actually measure; leave its weight at zero until the sensor exists.
Does the score replace our existing PM schedule?
No — it prioritizes and tunes it. Calendar-based PMs still run, but the score decides which assets get inspected this week, which get a deferred PM, and which get pulled forward for corrective work. Plants typically reduce total PM count by 10–20% while increasing PM effectiveness because hours go to degrading assets instead of healthy ones. You can Book a Demo to see a live PM-rebalancing example.
What is a healthy false-positive rate?
Aim for 5–10% in the first quarter and under 5% by month six. If 30% of amber work orders find nothing, supervisors stop trusting the number — and once trust is gone, adoption is permanent. Track diagnostic accuracy per asset class, not plant-wide, because a gearbox score and a pump score have very different noise floors.
Can the score work without a CMMS integration?
It can be calculated, but it cannot be operationalized. Without the CMMS link, the score lives on a wall display and someone has to manually create a work order — which is exactly the gap that kills most condition-monitoring programs. The integration is the whole point: band breach triggers WO, WO closes the loop, score trends back up.
How do we handle assets with no sensors?
Use a derived score from CMMS history alone — MTBF trend, overdue PM count, last-inspection findings, and operator round notes. It is less precise than a sensor-driven score, but it still ranks assets by risk and beats a static criticality label. Add a portable vibration route for Tier-B assets until permanent sensors justify their $400–$1,200 per-point cost.
Get Started Today
Your first machine health score goes live this week
Connect your sensors, set your weights, and watch band breaches generate work orders inside your CMMS. Most plants see their first prevented failure inside 30 days.
Free 14-day trial · No credit card


![equipment-asset-register-template-for-manufacturing-plants-[free-excel]](./manage-post-2k26/uploads/equipment-asset-register-template-for-manufacturing-plants-[free-excel].png)

