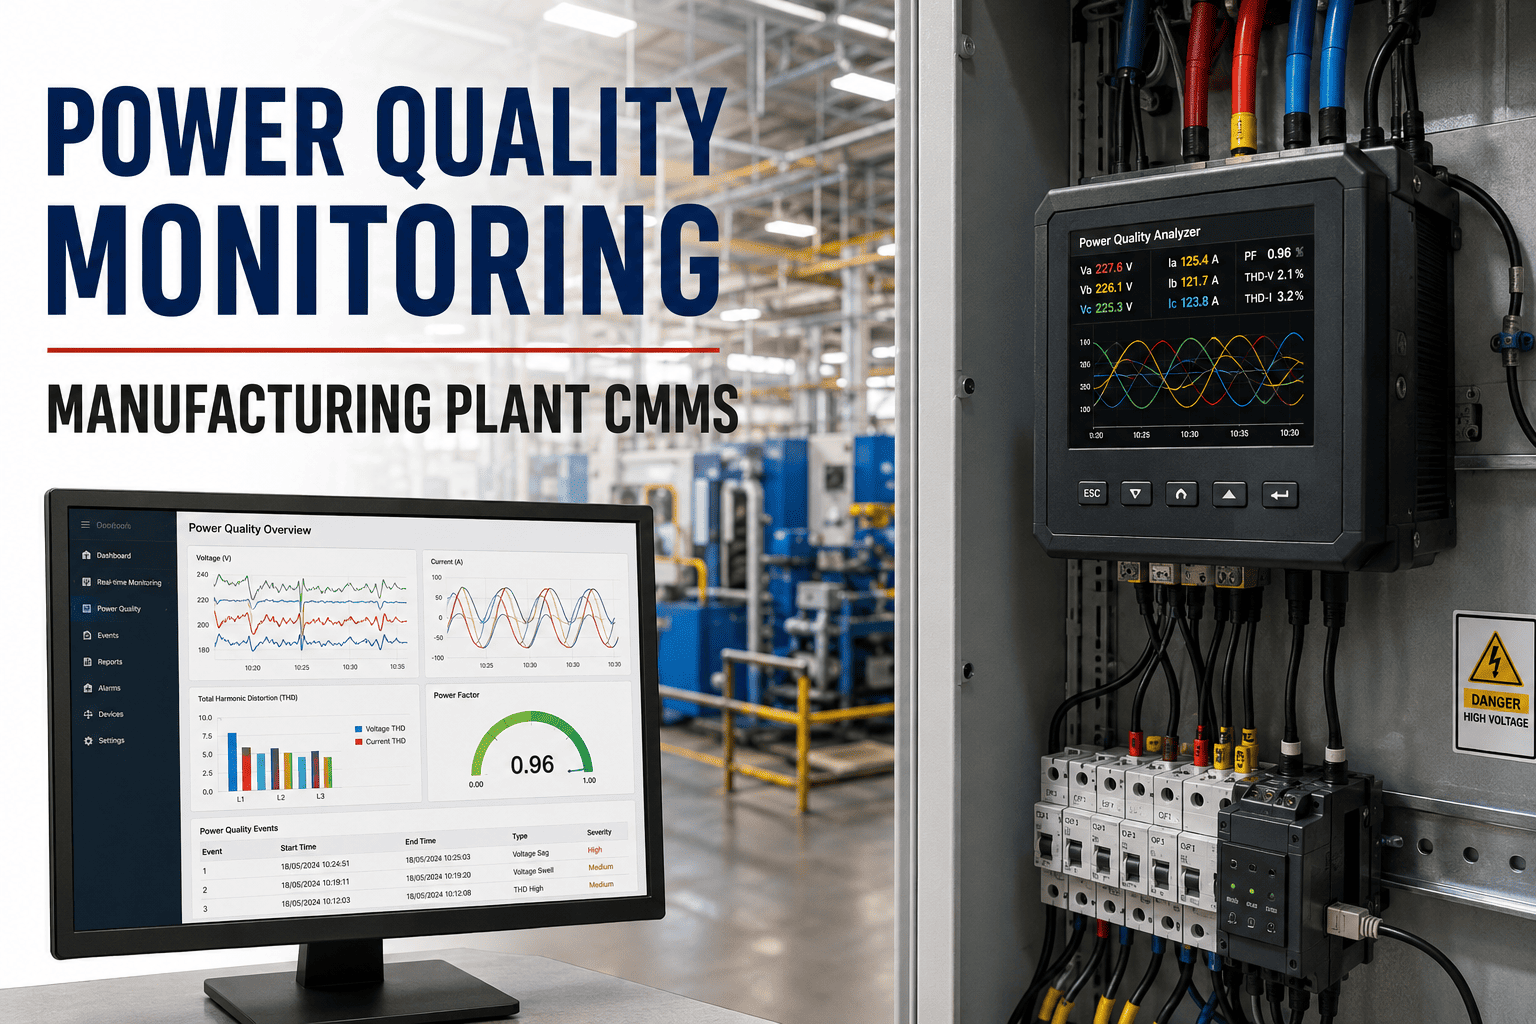
Power quality problems — voltage sags, harmonic distortion, transients, and phase imbalance — are behind a large share of the "unexplained" VFD trips, motor rewinds, and breaker nuisance operations that maintenance teams chase every quarter. Most plants treat these as mechanical failures, swap the component, and move on, which is why the same asset fails again within months. This guide breaks down how to instrument the right monitoring points, interpret IEEE 519 harmonic limits, and push power-quality events straight into your CMMS so a recurring trip becomes a root-caused defect instead of a recurring work order. If you want to skip ahead, you can Start Free Trial and connect your meter data today.
Are your VFD trips actually power quality events in disguise?
Up to 80 percent of "random" drive and motor failures traced at the panel level originate upstream — in sags, harmonics, and transients the mechanical team never sees. Continuous power quality monitoring turns those phantom trips into CMMS-tracked defects you can actually fix.
Why plants misdiagnose power quality as mechanical failure
A 150-asset CNC plant spending $42K a year on motor rewinds and replacement drives typically traces fewer than 10 percent of failures to the electrical supply — because nobody is recording what the voltage actually did at the moment the asset tripped.
A 180-asset plant, one recurring 37 kW motor
A packaging plant replaced the same 37 kW motor three times in 14 months — $11,200 in parts and $8,400 in lost runtime. A 14-day power quality log at the MCC revealed a 12-cycle voltage sag to 72 percent of nominal every time the facility's chiller compressor staged on. The fix was a soft-starter retrofit on the chiller, not another motor. Total monitoring investment: under $4,000. Payback: less than one quarter.
Four monitoring points every manufacturing plant needs
Coverage matters more than meter count. Instrument these four nodes and you will capture over 90 percent of power-quality events that actually reach your rotating assets.
The PCC is where IEEE 519 compliance is measured. A Class A recorder here captures every utility-side sag, swell, and transient before it enters the plant, and gives you the data to push back on the utility when a ride-through event originates upstream.
Trend voltage and current THD, individual harmonic orders to the 25th, and unbalance at the main bus. This is the artery of the plant — every feeder downstream inherits whatever distortion exists here.
VFDs are both victims and sources. Monitor at the MCC feeding drives larger than 25 kW to catch bus voltage sags that trip the drive's undervoltage protection — the single most common "phantom" trip in modern plants.
When a specific asset fails repeatedly, clamp a portable recorder on its feeder for 14 days. Capture shaft voltage, neutral-to-ground voltage, and current signature to isolate bearing-current versus supply-quality root causes.
Harmonic limits your monitoring must flag automatically
IEEE 519-2022 sets the ceiling for voltage distortion at the PCC. Your monitoring system should alert the moment you cross 80 percent of the limit, not after you fail a utility audit.
For bus voltages under 1 kV at the PCC. Individual harmonic orders must stay below 3.0 percent each. Exceeding this triggers utility penalties and ride-through failures on connected drives.
Depends on ISC/IL ratio at the PCC (Table 2). A plant with a stiff supply (ISC/IL > 1000) gets a 20 percent allowance; a weak supply (ISC/IL < 20) is capped at 5 percent. Your meter must calculate TDD, not just THDi.
| ISC / IL Ratio | Max TDD | Odd Harmonics (3rd–11th) | Even Harmonics |
|---|---|---|---|
| < 20 | 5.0% | 4.0% | 1.0% |
| 20 – 50 | 8.0% | 7.0% | 1.5% |
| 50 – 100 | 12.0% | 10.0% | 1.5% |
| 100 – 1000 | 15.0% | 12.0% | 2.0% |
| > 1000 | 20.0% | 15.0% | 2.5% |
What to record when an asset trips — and for how long
The difference between root-causing a trip and guessing is a 5-cycle waveform capture window. Set your recorders with these defaults and you will never lose another event to a "buffer overwritten" message.
Sag & Swell Capture
Trigger at ±10 percent of nominal voltage. Record 5 cycles pre-event and 10 cycles post-event at 256 samples/cycle. Flags ride-through failures on VFDs rated per IEC 61800-3.
Transient Recording
Impulsive transients above 1.5 pu require 1 MHz sampling to resolve. Switching capacitor banks and lightning events live here — the most damaging and the least captured.
Harmonic Trending
Log THDv, THDi, TDD, and individual orders 2nd–25th every 10 minutes. A 30-day trend reveals the load profile that pushes the bus over the IEEE 519 ceiling during shift changeovers.
Flicker & Unbalance
Voltage unbalance above 2 percent raises motor winding temperature by 25 percent per NEMA MG-1. Track PST/PLT flicker indices if lighting or sensitive electronics share the bus.
Turn every VFD trip into a CMMS work order with power-quality evidence
Connect your meters, auto-generate defect work orders, and watch repeat failures drop by 40 percent in the first quarter.
Linking power quality data to maintenance actions
Data without a workflow is just a dashboard. The payoff comes when a sag event at the MCC automatically opens a CMMS work order, attaches the waveform, and routes it to the electrician on shift.
Meter flags a qualifying event
A power quality meter at the MCC detects a voltage sag to 78 percent of nominal lasting 6 cycles — below the VFD's 85 percent ride-through threshold. The event is time-stamped and the waveform snapshot is archived.
CMMS matches the timestamp to an asset trip
The CMMS pulls the VFD fault log, sees a DC undervoltage (F3) trip at the exact same timestamp, and links the two records. The work order is auto-created with the waveform attached as evidence — no manual data entry.
Severity scoring routes the work order
A recurrence rule checks how many times this asset tripped in the last 30 days. Three strikes escalates from "monitor" to "corrective" priority, assigns the plant electrician, and schedules the investigation window.
Root cause fixed, defect closed with data
The electrician installs a line reactor or active filter, the sag depth drops below the trip threshold, and the CMMS closes the defect with before/after trend charts. Repeat-failure MTBF improves measurably within one PM cycle.
Replace and repeat
- VFD trips logged as "unknown cause"
- Motor rewound every 9–14 months
- Utility blamed without evidence
- No waveform, no trend, no defense
- Repeat failures treated as bad luck
Detect, root-cause, and prevent
- Every trip tagged with sag, harmonic, or transient data
- Auto work order with waveform evidence attached
- IEEE 519 compliance tracked continuously
- Repeat-failure rule escalates before the 3rd event
- MTBF up 35–60 percent in tracked plants
The maintenance side of power factor correction
A power factor below 0.95 costs you in utility penalties and wasted transformer capacity. But unmanaged correction — switching capacitors into a harmonic-rich bus — creates resonance that destroys the caps and amplifies distortion.
A bus feeding VFDs without reactors often sits at 0.82–0.87 lagging. Utility penalties kick in below 0.90 in most tariffs, adding 1–3 percent to the monthly demand bill.
A detuned capacitor bank or active VAR compensator holds the bus at 0.96–0.99 leading without crossing into leading territory, which can cause overvoltage on lightly loaded feeders.
A 7 percent detuning reactor shifts the capacitor's resonant frequency below the 5th harmonic order (250 Hz on a 50 Hz system), preventing resonance and protecting the caps from harmonic overload.
Power quality monitoring — what plant teams ask first
How quickly can power quality monitoring pay for itself?
Most plants see payback within 6 to 9 months. A single avoided motor rewind ($8K–$15K) or one prevented production line stoppage often covers the cost of a four-point monitoring system. A 180-asset plant with recurring VFD trips typically recovers a $15K instrumentation investment in under one quarter once the first root cause is identified and fixed.
Do I need a Class A meter at every monitoring point?
No. Class A (per IEC 61000-4-30) is required at the PCC for compliance and utility disputes. Class S meters are sufficient at internal MCCs and load feeders for trending and event capture. Mixing the two keeps the total project cost manageable — typically $3K–$8K for a four-point system instead of $20K+ for all-Class-A.
How does power quality data flow into my CMMS?
Most modern meters support Modbus TCP, OPC UA, or MQTT. An integration layer reads event flags and waveform summaries, then pushes a structured work order via REST API to the CMMS. You can see this in action — Book a Demo and we will walk through the meter-to-work-order flow on your plant's architecture.
What is the difference between THDi and TDD, and why does it matter?
THDi is total harmonic distortion as a percentage of the fundamental current at a given moment — it spikes when the load is light. TDD (Total Demand Distortion) is harmonic current as a percentage of the maximum demand current, which gives a stable, compliance-ready number. IEEE 519 is written around TDD, so your meter must report TDD, not just THDi, or you will over-report violations.
Can power quality monitoring prevent bearing failures in VFD-fed motors?
Partially. Shaft voltage and bearing current monitoring — usually a shaft grounding ring plus a high-frequency current probe — detects the EDM discharge that pits bearing races. Combined with common-mode voltage trending at the drive output, you can predict bearing failure weeks before vibration picks it up and justify a shaft-grounding retrofit before the next rewind. Sign up for a Start Free Trial to map this to your asset register.
Stop replacing motors that fail because of the power supply
Instrument the right points, log every event to IEEE 519, and let your CMMS turn power quality data into closed defects.
Free 14-day trial · No credit card