You can't improve what you don't measure — and most plants still measure the wrong thing. They count hours worked and jobs closed, not whether equipment is actually getting more reliable. OXMAINT AI is the AI-powered maintenance management software that turns the work orders you already raise into a live KPI dashboard — OEE, MTBF, MTTR, downtime and PM compliance, computed from your own data, not a spreadsheet filled in once a month.
Maintenance KPIs · OEE · MTBF · MTTR · Downtime · 2026
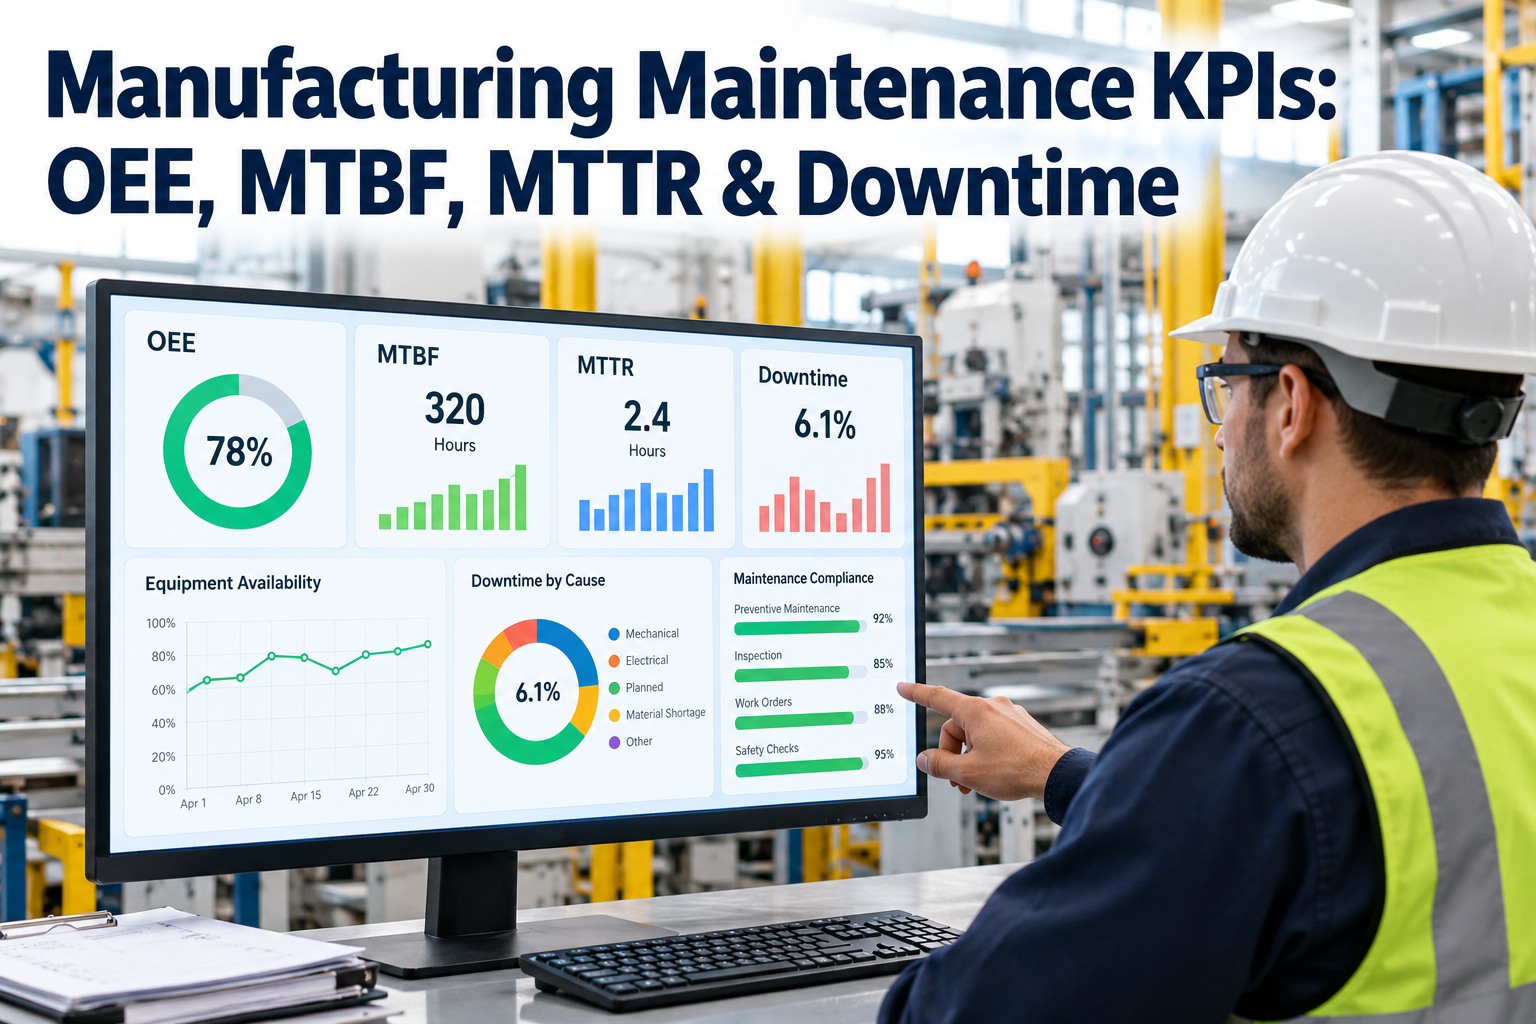
Manufacturing Maintenance KPIs: OEE, MTBF, MTTR & Downtime
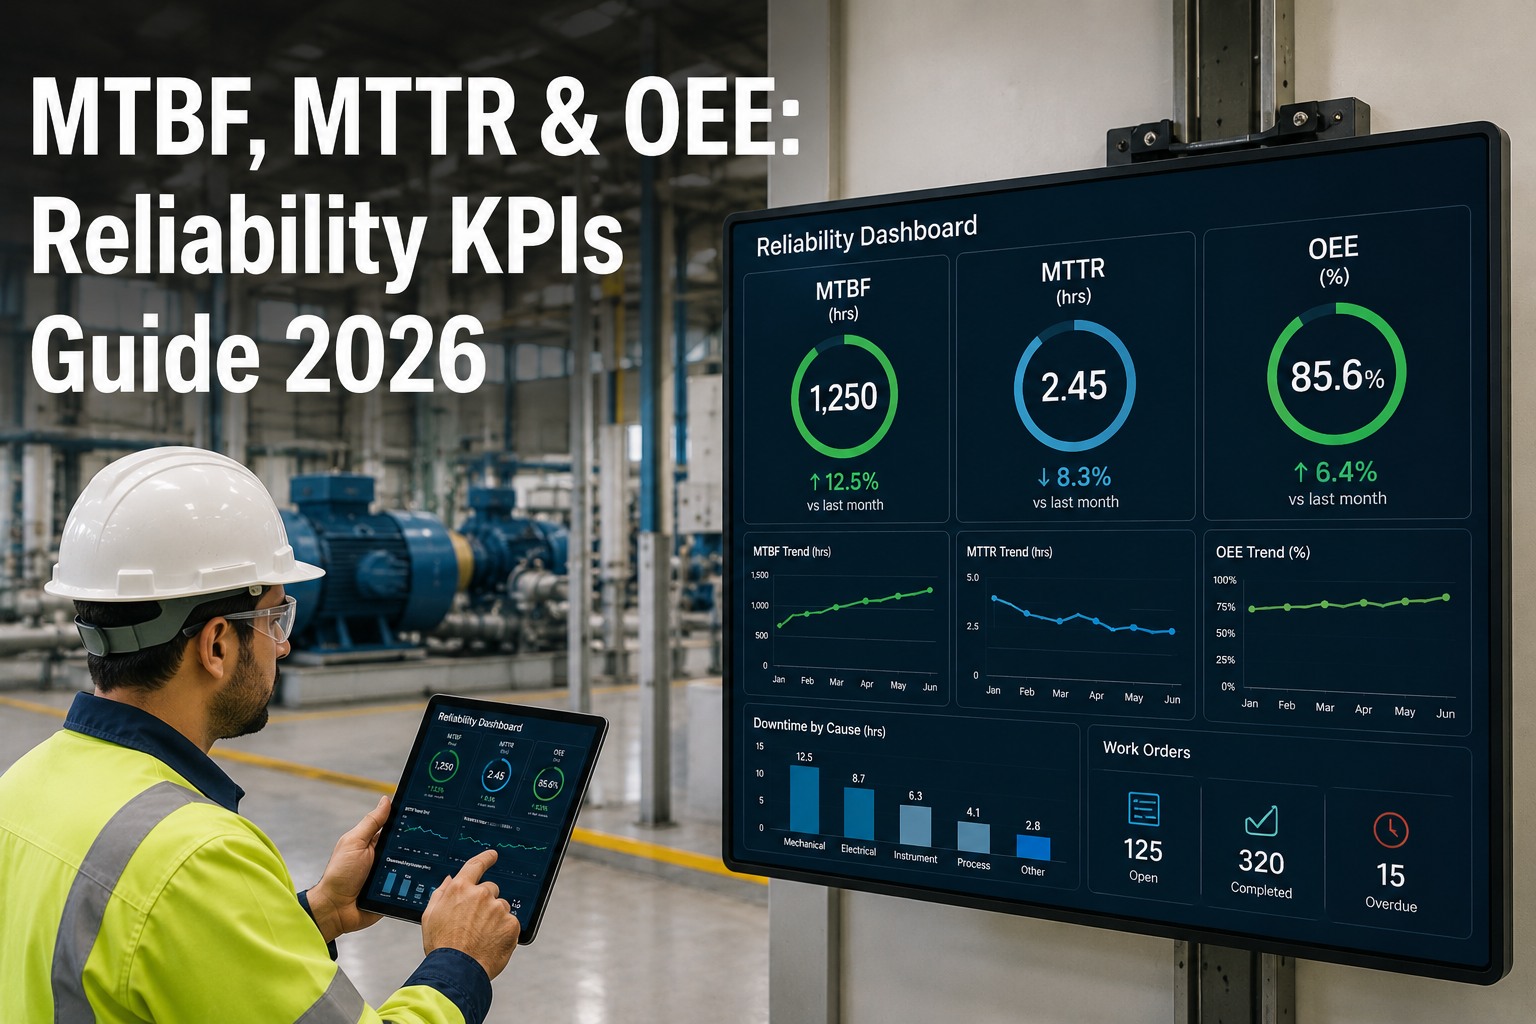
Five numbers tell you whether your maintenance program is working — and whether equipment is getting more reliable or quietly falling apart. OXMAINT AI, the AI-powered CMMS and maintenance analytics software, builds every one of them automatically from your work-order and asset history, so you stop guessing from gut feel and start managing from a live scoreboard.
OEE
MTBF
MTTR
Downtime
PM %
85%
world-class OEE benchmark (Availability 90% × Performance 95% × Quality 99%)
~60%
typical OEE at an average manufacturing plant
$260K
average cost of one hour of unplanned downtime across sectors
≥90%
PM compliance target that separates planned from reactive plants
The Five KPIs That Actually Matter
There are dozens of maintenance metrics. These five carry most of the signal: one tells you how productive the line is, two tell you how reliable the equipment is, and two tell you whether your program is in control. Each one is a simple formula — the hard part is getting clean data under it.
PRODUCTIVITY
OEE
Overall Equipment Effectiveness
Availability × Performance × Quality
Answers: how much good output you get versus your theoretical best. The single most complete health score for a line.
World-class: 85%
PRODUCTIVITY
Availability
Uptime share
Run Time ÷ Planned Production Time
Answers: of the time the line was meant to run, how much it actually ran. The piece of OEE maintenance owns most directly.
World-class: 90%
RELIABILITY
MTBF
Mean Time Between Failures
Total Operating Time ÷ Number of Failures
Answers: how long an asset typically runs before it breaks. Rising MTBF means your reliability work is paying off.
Higher is better
RELIABILITY
MTTR
Mean Time To Repair
Total Repair Time ÷ Number of Repairs
Answers: when it does break, how fast you get it running again. Falling MTTR means faster, better-prepared response.
Lower is better
CONTROL
PM Compliance
Schedule adherence
PMs Done On Time ÷ PMs Scheduled
Answers: are you doing the planned work that prevents failures, or letting it slip? The leading indicator for everything else.
Target: 90%+
CONTROL
Downtime Rate
Unplanned stop share
Unplanned Downtime ÷ Planned Production Time
Answers: how much of your run time you are losing to surprises. The number finance feels fastest.
Lower is better
Track all five together and they tell a story no single number can; chase just one and you can game it while the plant gets worse. Start free and put all five KPIs on one live board in OxMaint.
OEE, Decomposed: Where the Losses Hide
OEE looks like one number, but it is three multiplied together — and multiplication is unforgiving. Three "pretty good" factors still land well short of world-class. Breaking OEE into its parts is the fastest way to find which loss is actually costing you.
90%
Availability
Lost to breakdowns, changeovers, setup and waiting for parts or operators.
×
95%
Performance
Lost to slow cycles, minor stops and running below the ideal rate.
×
99%
Quality
Lost to scrap, rework and defects made during startup.
=
84.6%
OEE
Three strong factors, still a hair under world-class. That is the math.
The point isn't the arithmetic — it's that an 8-point dip in any one factor drags the whole score down, so you fix the weakest factor first. Book a demo to see your OEE split into its three factors in OxMaint.
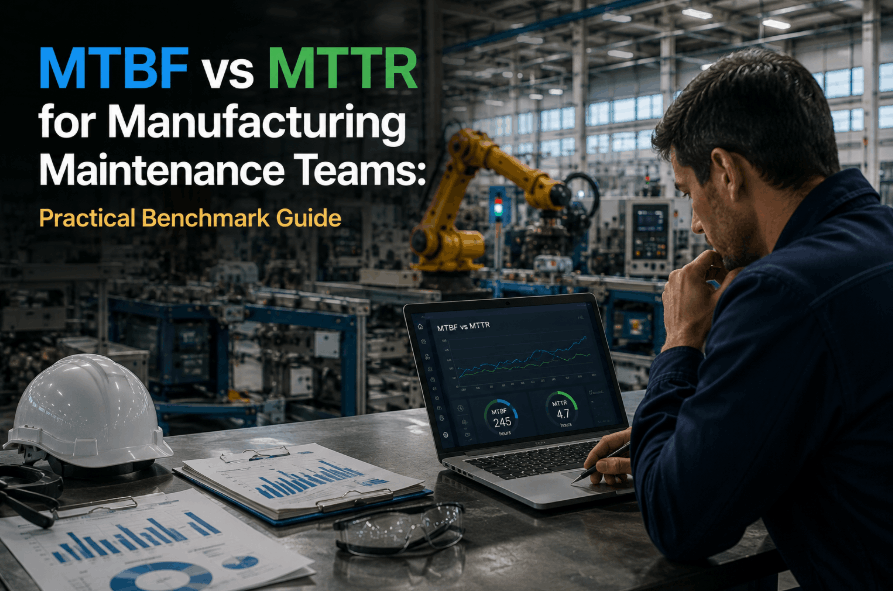
MTBF vs MTTR: Two Clocks on Every Asset
Reliability lives in the gap between failures and the speed of recovery. MTBF measures how long an asset runs before it fails; MTTR measures how long it takes to get it back. Here is the same asset's run-and-repair cycle, with each clock marked.
Running
⚠
Repair
Running
⚠
Repair
Running
MTBF spans the running time between failures — stretch it longer
MTTR spans the repair time at each failure — shrink it shorter
1,200 operating hours ÷ 8 failures= MTBF 150 h
24 repair hours ÷ 8 repairs= MTTR 3 h
Read together, they separate a reliability problem from a response problem: low MTBF means the asset keeps failing; high MTTR means you are slow to recover when it does. Start free and track MTBF and MTTR per asset in OxMaint.
A KPI You Calculate Once a Month Is a Postmortem, Not a Dashboard.
By the time a spreadsheet metric is finished, the month is over and the losses are banked. OxMaint computes every KPI from work orders as they close — so the number on the board is today's, and you can act while it still matters.
Which KPI Answers Which Question
Each metric is good at exactly one job. Use the wrong one and you will optimize the wrong thing — here is the cheat sheet.
The pattern matters more than any single reading: PM compliance leads, MTBF and downtime follow, and OEE is the scoreboard at the end. Book a demo to map these KPIs to your own assets in OxMaint.
How OxMaint Builds These KPIs Automatically
The reason most KPI programs fail isn't the formulas — it's the data under them. OxMaint captures the right data as a by-product of normal maintenance, so the metrics assemble themselves.
Asset Register & Meters
Every asset carries its own run hours, failure count and repair log — the raw inputs behind MTBF, MTTR and availability.
Automatic Timestamps
Work orders stamp the moment a failure is logged and the moment it closes — so MTBF and MTTR are measured, not estimated.
Downtime Logging
Planned and unplanned stops are tagged against the asset, so downtime rate and availability come from real events, not memory.
PM Compliance Tracker
Scheduled PMs are measured against on-time completion automatically — your leading indicator, always current.
Live KPI Dashboard
OEE, MTBF, MTTR, downtime and PM compliance on one screen, by asset, line or site — refreshed as work orders close.
Trends & Alerts
See each KPI move over time and get flagged when a metric drifts off target — before it shows up in the output.
You don't build a reporting project on the side — the KPIs are a by-product of running maintenance in one place. Sign up free and let your KPIs build themselves in OxMaint.
Reviewed by OxMaint Reliability & Maintenance Operations
KPI definitions and formulas were checked against standard reliability and TPM practice. Benchmark and downtime figures reflect published 2024–2026 industry data; treat targets as reference points and calibrate them to your own assets and duty cycles.
Frequently Asked Questions
What is a good OEE for a manufacturing plant?
85% is the world-class benchmark (90% availability × 95% performance × 99% quality). A typical plant runs closer to 60%, so the gap between the two is usually where the biggest, cheapest gains are.
What's the difference between MTBF and MTTR?
MTBF measures how long an asset runs between failures — you want it higher. MTTR measures how long it takes to repair after a failure — you want it lower. One is a reliability problem, the other a response problem.
Which maintenance KPI should we start with?
Do I need sensors to track these KPIs?
No. MTBF, MTTR, downtime and PM compliance all come from work-order and asset records. Sensors help with condition-based metrics, but the core reliability KPIs are built from the maintenance data you already generate.
How often should maintenance KPIs be reviewed?
Watch the dashboard continuously and review trends weekly; a monthly-only number is a postmortem. Live KPIs let you act on a dip while the shift is still running.
Stop Reporting the Past. Manage the Live Number.
Put OEE, MTBF, MTTR, downtime and PM compliance on one live board with OXMAINT AI — every metric computed from your own work orders and asset history, trended over time, and flagged the moment it drifts off target. Measure reliability, find the gaps, and win back the uptime.

![machine-downtime-tracking-template-for-manufacturing-[excel-dashboard]](./manage-post-2k26/uploads/machine-downtime-tracking-template-for-manufacturing-[excel-dashboard].png)