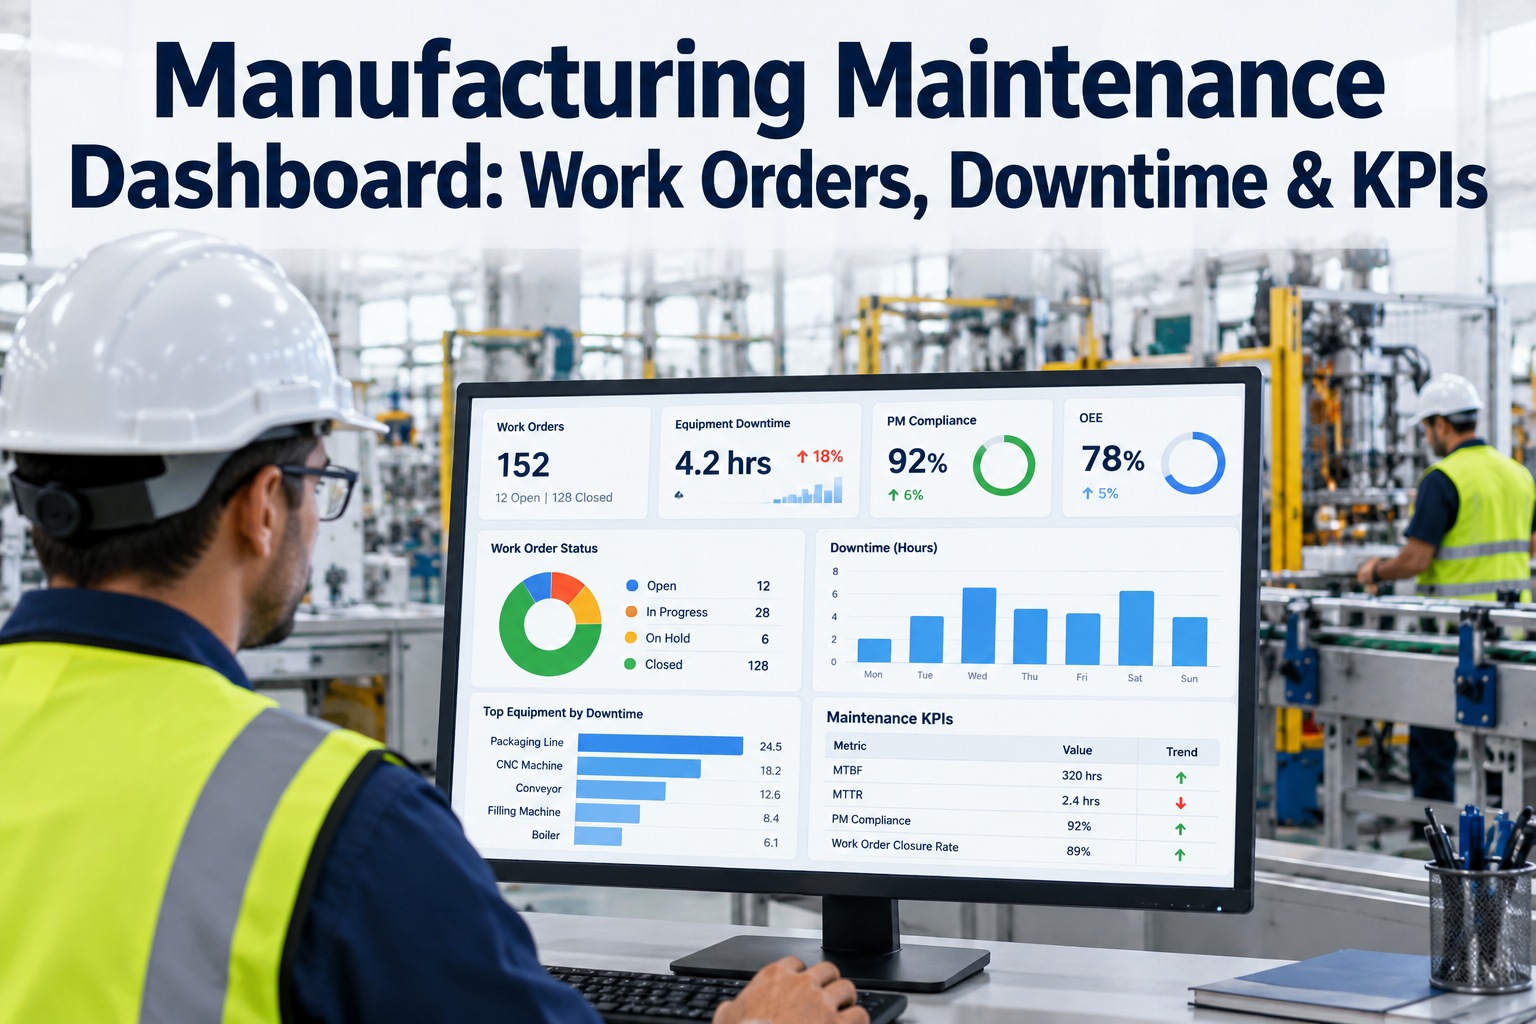
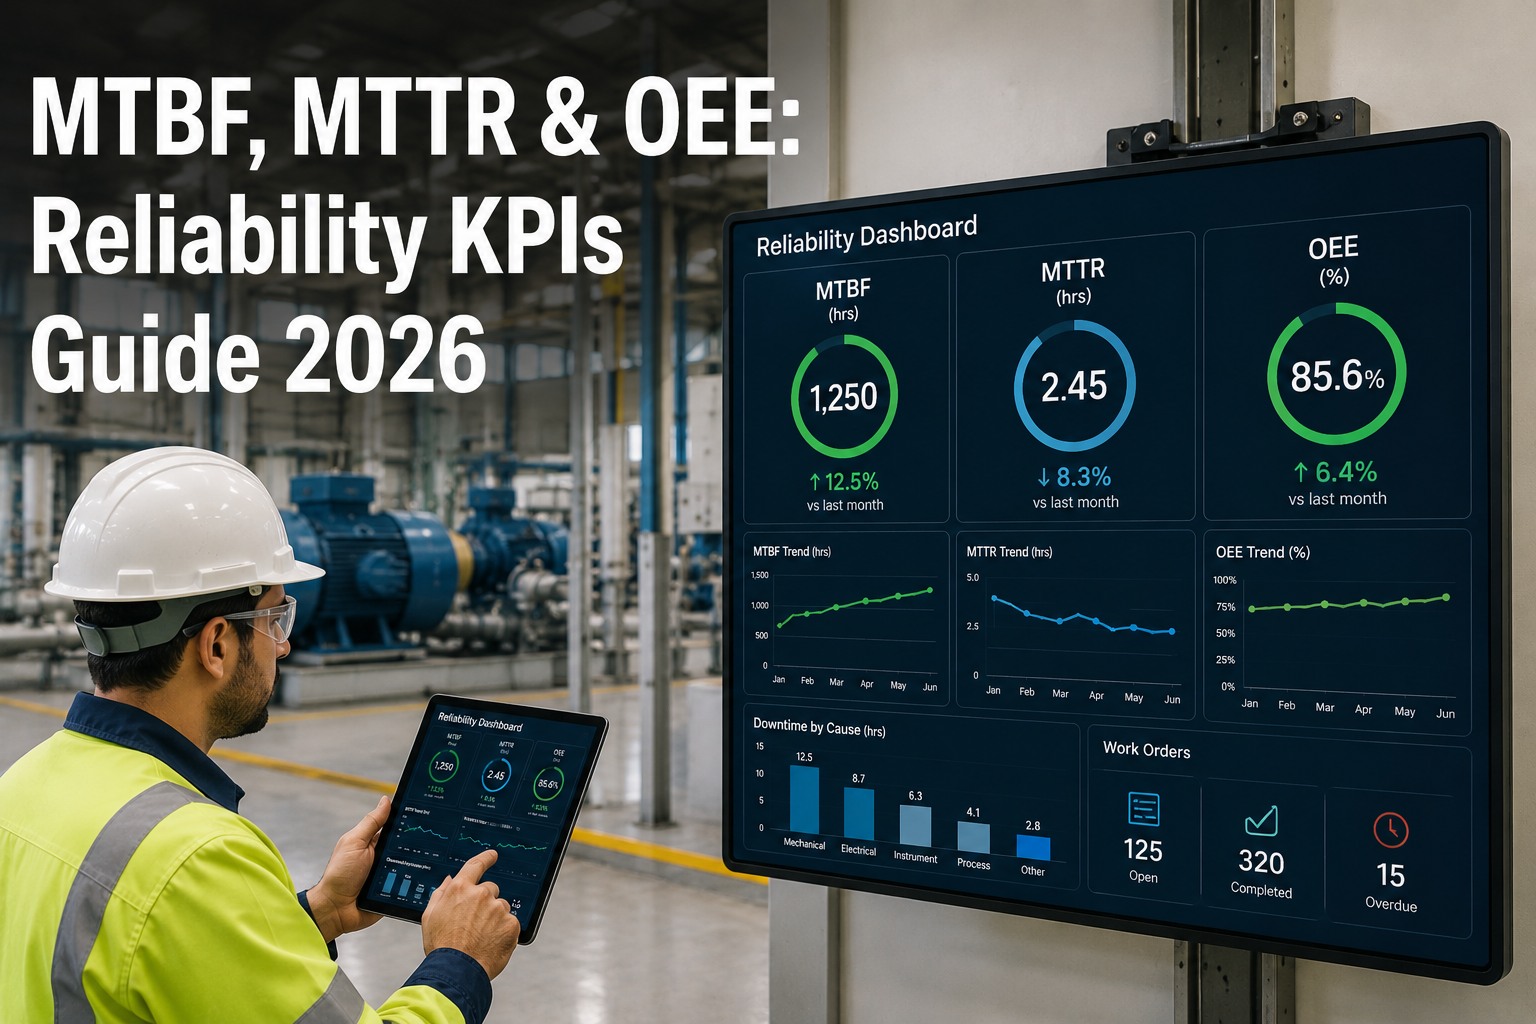
A manufacturing maintenance dashboard that opens on a hundred metrics tells the plant manager nothing. The dashboard that actually gets opened at 6am ops meeting is six KPIs, one WO funnel, one downtime Pareto and one OEE breakdown — and the five-minute scroll ends with a work-list, not a status readout. This guide walks the KPI tile set, the WO lifecycle funnel, the OEE decomposition, the MTBF / MTTR math, the downtime Pareto and the live board. OXMAINT AI is the AI-powered industrial maintenance software that computes every KPI live from the WO log and the production record, renders the full dashboard on one screen and converts the morning meeting into a work-list the shift takes to the floor.
MANUFACTURING MAINTENANCE DASHBOARD · WORK ORDERS, DOWNTIME & KPIs · 2026
Manufacturing Maintenance Dashboard: Work Orders, Downtime & KPIs
Six KPI tiles, one WO funnel, one Pareto, one OEE decomposition. OXMAINT AI computes every number live from the WO log and the production record so the dashboard runs as the morning ops tool.
The Six KPI Tiles — What Earns Permanent Dashboard Real-Estate
Six KPIs cover work-order volume, work-order quality, equipment reliability and the production outcome. More than six becomes a report. OXMAINT AI holds each with its definition and sparkline on the live dashboard in the industrial maintenance software.
VOLUME
Open WOs
142
Total open across all tiers. Trend up over 7 days signals backlog pressure.
VOLUME
Overdue WOs
31
Past-due count. The actionable queue — today's work-list.
QUALITY
PM compliance %
96%
PMs closed inside window / PMs scheduled. Leading indicator for next quarter MTBF.
RELIAB
MTBF critical
820 h
Mean time between failures on critical assets. The reliability direction-of-travel.
RELIAB
MTTR
3.4 h
Mean time to repair. Team capability and parts chain — lower is better.
OUTCOME
OEE
79%
Availability × Performance × Quality. The outcome KPI the plant lives by.
The Work-Order Funnel — Where WOs Live Right Now
A WO queue count hides the pipeline shape. The funnel below is the real view: how WOs flow from raised to closed, and where they stall. OXMAINT AI renders it live — the wide stage is the bottleneck.
WORK ORDER FUNNEL · LIVE · LAST 24 HOURS
02 · Triaged / assigned162
04 · On hold / waiting parts64
OEE Decomposition — The Three Factors Behind The One Number
An OEE number is three multiplications hiding as one. The breakdown below is where the maintenance lever lives — availability is almost entirely a maintenance outcome.
OEE = Availability × Performance × Quality
AVAILABILITY
87%
Running time ÷ planned time. The maintenance KPI — every unplanned downtime minute lands here.
Owned by: Maintenance
PERFORMANCE
94%
Actual rate ÷ design rate. Micro-stops, speed losses, minor stoppages. Shared with production.
Owned by: Prod + Maint
QUALITY
96%
Good units ÷ total units. Startup rejects + run-time defects. Mostly production / quality.
Owned by: Production
OEE
79%
0.87 × 0.94 × 0.96 = 0.79. 1 point of OEE ≈ 1 point of availability for most plants.
Plant-level outcome
MTBF & MTTR Math — What The Numbers Actually Measure
Two numbers, two different stories. MTBF measures reliability; MTTR measures team capability. The dashboard shows both — moving one does not necessarily move the other.
MTBF · Mean Time Between Failures
MTBF = Total uptime ÷ Number of failures
Example: 7,200 h total uptime ÷ 9 failures = 800 h MTBF
A reliability metric. Moved by better PMs, better materials, better operating practices. Target: trending up.
MTTR · Mean Time To Repair
MTTR = Total repair time ÷ Number of repairs
Example: 32.4 h total repair ÷ 9 repairs = 3.6 h MTTR
A capability metric. Moved by parts availability, technician skill, procedure quality. Target: trending down.
Downtime Pareto — The 80/20 Of Lost Hours
A downtime report that lists every event hides the pattern. A Pareto chart ranks the hours by cause code; the top four causes almost always carry 70-80% of the loss. OXMAINT AI renders the Pareto live from the WO log and the production record.
DOWNTIME CAUSE PARETO · LAST 30 DAYS · HOURS LOST
01 · Bearing failure · line 3
34 h
02 · Changeover overrun
23 h
03 · Jam · conveyor merge
16 h
04 · Vision reject rate spike
13 h
05 · PLC comm fault
8 h
06 · Utility (air / power)
6 h
07 · Operator wait
4 h
08 · Other
3 h
The Dashboard Is Not The Report. The Dashboard Is The Work-List.
A plant manager who opens the dashboard at 6am wants to leave the meeting knowing which three WOs matter today, not the entire month's statistics. OXMAINT AI drills from every tile and bar to the specific WO on the floor.
Live Line Board — Asset-Level Drill-Down
The line board is where the aggregate dashboard numbers resolve to specific assets. Each line's current state, OEE today, open WOs, and the next scheduled event. OXMAINT AI renders it live from the shop-floor feed.
MANUFACTURING LINE BOARD · PLANT · 14:11
Line 03 · packagingBearing fault · shaft seized · P1 WO 71422DOWN 2h 14m · ETA 15:30
Line 07 · fillMinor-stop cluster · OEE 71% vs 85% targetINVESTIGATE · WO 71418
Line 11 · labelVision reject 4.2% vs 1.5% baselineINVESTIGATE · WO 71414
Line 02 · blendOEE 88% · on targetOK
Line 05 · sterilizeOEE 91% · above targetOK
Six Dashboard Habits That Keep It Opened
A dashboard that gets a quarterly glance is a report. A dashboard the plant manager opens with coffee is a system. Six habits make the difference.
01
Six KPIs, not twenty
The brain groups ~6 things at once; past that, the dashboard reads as a report.
02
Click from every tile
Every KPI drills to the WOs behind it — otherwise the number has no work-list.
03
Live, not daily refresh
Overnight-batched is a report; live-refresh from the WO log is a tool.
04
Pareto, not timeline
A ranked downtime list prioritizes the work. A time-series chart defers it.
05
Target lines on every tile
A number without a target is a trivia point. Each tile shows what the number should be.
06
Shift export in one click
The 6am dashboard becomes the shift brief. One-click export, no re-typing, no reconciliation.
How OXMAINT AI Runs The Dashboard
The six-KPI tiles, WO funnel, OEE decomposition, MTBF / MTTR math, downtime Pareto and the live line board all live natively in the OXMAINT AI industrial maintenance software — load the dashboard in OXMAINT AI today.
Live KPI Tiles
Six KPIs computed live from the WO log and production record; sparkline + target per tile.
WO Funnel
Raised → Triaged → In-progress → On-hold → Closed; the stall point is visible without a report.
OEE Decomposition
Availability × Performance × Quality factored, so the maintenance lever is isolated from the production lever.
Downtime Pareto
Cause-code ranked by hours; the 4 bars that carry 80% of the loss become the quarter's work-streams.
Line Drill-Down
Every aggregate number drills to the line, asset and WO. The dashboard is the work-list source.
Shift Brief Export
One-click export of the morning's dashboard as the shift brief — no reconciliation, no re-typing.
Frequently Asked Questions
How often should the dashboard refresh?
Continuously from the WO log for most tiles; every 1-15 minutes from the shop-floor feed for availability and performance. Overnight-batched refresh turns the dashboard into a report. OXMAINT AI runs on live-refresh so the morning meeting opens the same screen the shift takes to the floor.
Which KPI moves the needle fastest on OEE?
Availability. 1 point of availability is roughly 1 point of OEE because performance and quality are already high in most plants. Availability is almost entirely a maintenance outcome, which is why the WO backlog and MTBF trend sit next to OEE on the dashboard.
Can we have more than six KPIs?
In detail views, yes. On the main dashboard, no — past six, the brain stops integrating and the dashboard reads as a report. The additional KPIs belong on sub-dashboards clickable from the main tiles. OXMAINT AI structures them that way by default.
How does this interact with the plant MES / historian?
OEE and performance feed in from the MES / historian; maintenance KPIs come from OXMAINT AI's own WO log. The two sources merge at the asset record so the maintenance view and the production view look at the same number.
The Morning Meeting Opens One Screen. The Shift Takes The Same Screen To The Floor.
Load the dashboard in the OXMAINT AI industrial maintenance software — six KPI tiles, WO funnel, OEE decomposition, MTBF / MTTR math, downtime Pareto and the live line board. The dashboard is the work-list, not the report.