Manufacturing plant leaders can't improve what they don't measure. Tracking the right maintenance KPIs — MTBF, MTTR, OEE, PM compliance, wrench time, and cost as a percentage of replacement asset value — turns maintenance from a reactive cost center into a measurable driver of uptime and profitability. This guide breaks down the 12 manufacturing maintenance KPIs that matter most in 2026, with world-class benchmark targets your plant can track from day one. Sign Up Free and start capturing every KPI automatically inside Oxmaint AI.
Turn Maintenance Data Into Decisions
Oxmaint AI tracks MTBF, MTTR, OEE, PM compliance, and cost KPIs in real time — no spreadsheets, no manual rollups.
Why Manufacturing Maintenance KPIs Matter
Maintenance KPIs give plant managers an objective view of asset reliability, technician productivity, and maintenance spend — replacing gut-feel decisions with data. Without consistent KPI tracking, backlog grows quietly, PM compliance slips, and reactive repairs consume budget that should fund preventive work. A connected CMMS platform closes this gap by capturing every work order, sensor reading, and labor hour automatically, so KPIs reflect what is actually happening on the plant floor rather than what gets logged manually days later. Book a Demo to see how Oxmaint AI calculates every KPI below without extra data entry.
KPI Categories Every Plant Should Track
Reliability Metrics
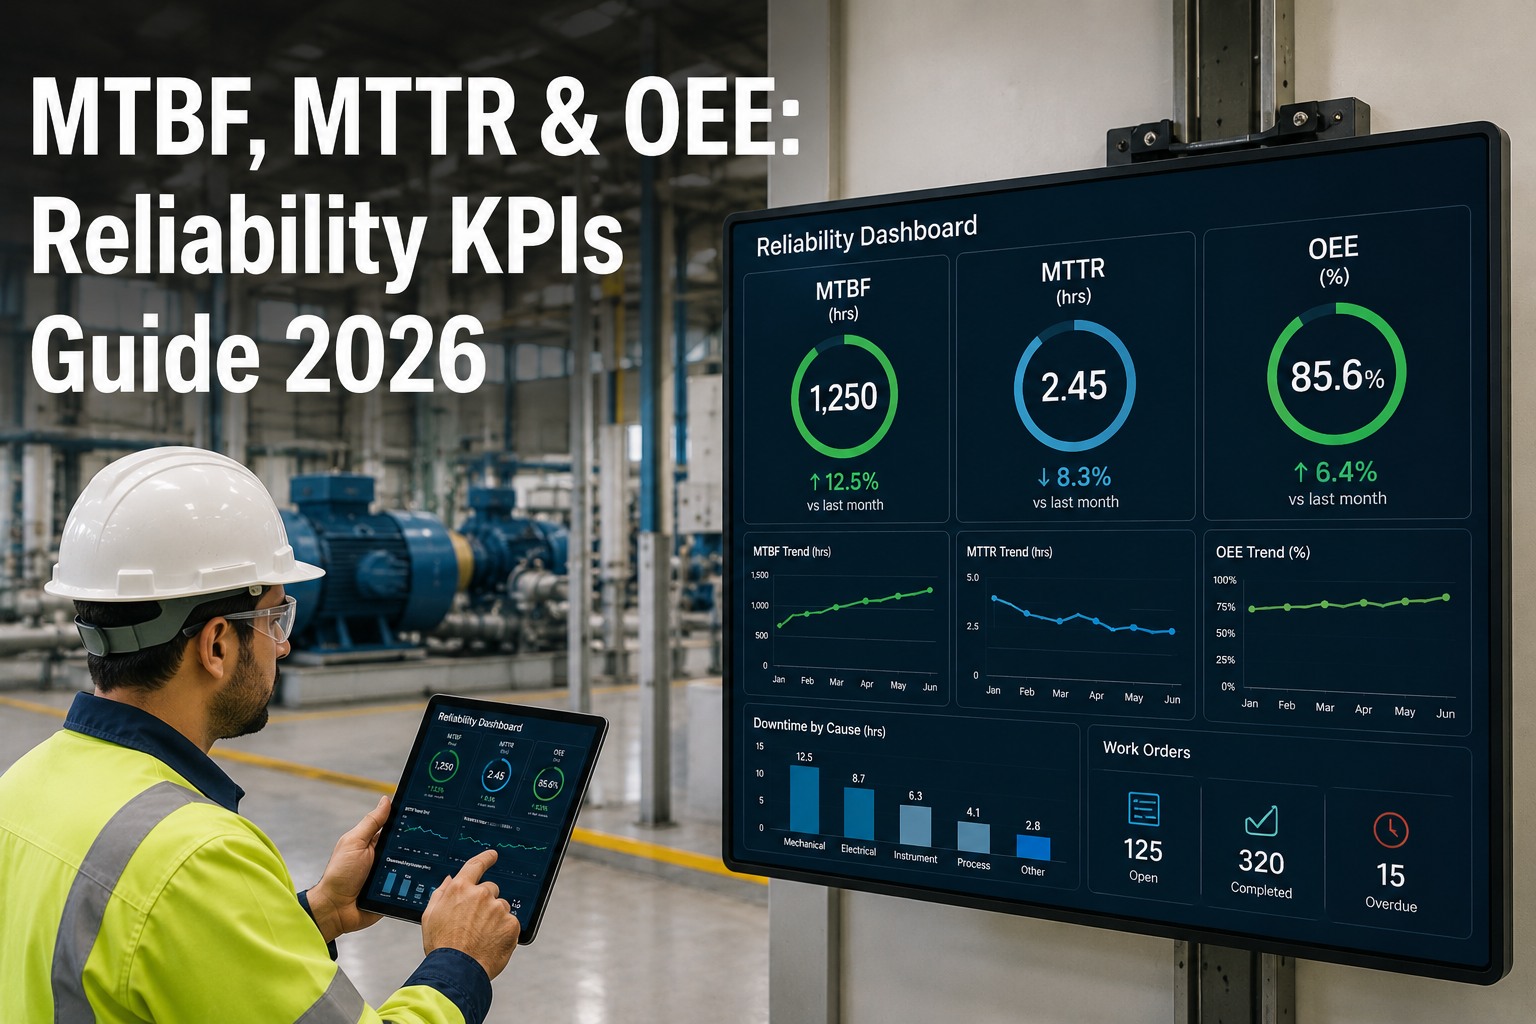
MTBF and MTTR reveal how often assets fail and how fast your team recovers from failure.
Productivity Metrics
OEE and wrench time show how effectively equipment and technician time convert into output.
Compliance Metrics
PM compliance and schedule attainment confirm planned work is actually being executed on time.
Cost Metrics
Maintenance cost as a percent of replacement asset value benchmarks spend against industry norms.
Inventory Metrics
Parts availability and stockout rate flag whether inventory is enabling or blocking execution.
Safety Metrics
Incident rate and PPE compliance connect maintenance discipline directly to plant safety outcomes.
12 Essential Manufacturing Maintenance KPIs for 2026
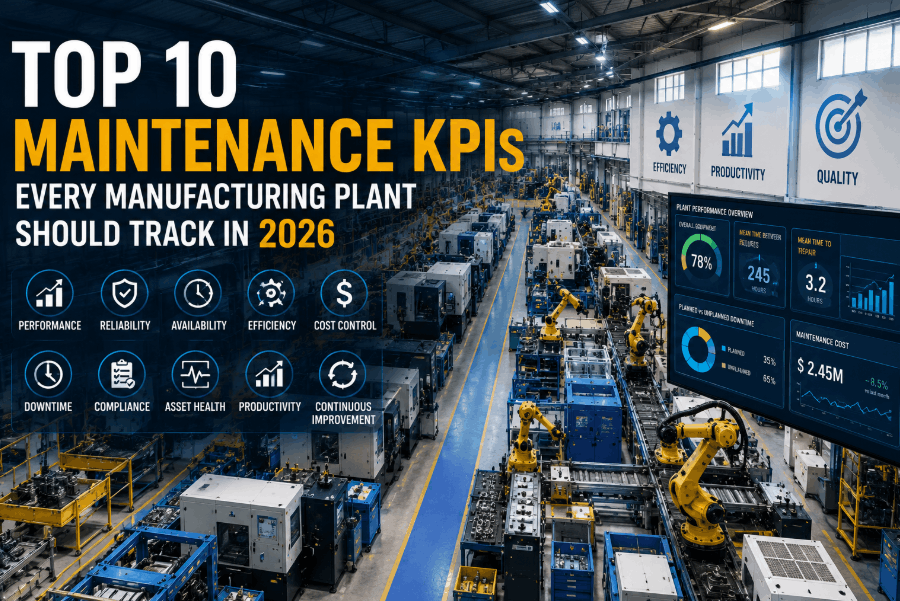
The table below defines the 12 KPIs manufacturing reliability leaders use to benchmark plant performance in 2026, along with formulas and world-class targets. Sign Up Free to auto-generate this dashboard for your own plant.
| KPI | How to Calculate | Why It Matters | World-Class Target |
|---|---|---|---|
| MTBF | Total uptime hours ÷ number of failures | Measures asset reliability between breakdowns | Trending upward year over year |
| MTTR | Total repair hours ÷ number of repairs | Measures how fast the team restores failed assets | < 4 hours for critical assets |
| OEE | Availability × Performance × Quality | Combined view of equipment productivity and output quality | > 85% world-class |
| PM Compliance Rate | PMs completed on time ÷ PMs scheduled × 100 | Tracks execution of preventive work before it becomes corrective | > 90% |
| Wrench Time | Hands-on productive hours ÷ total work hours × 100 | Shows how much technician time is actually spent on tools | > 50%, 55%+ best-in-class |
| Cost as % of RAV | Annual maintenance cost ÷ replacement asset value × 100 | Benchmarks total maintenance spend against industry norms | 2–3% annually |
| Schedule Compliance | Scheduled WOs completed as planned ÷ total scheduled × 100 | Measures execution discipline of the weekly schedule | > 85% |
| Backlog Ratio | Backlog hours ÷ weekly available technician hours | Shows how long it would take to clear open work at current capacity | 4–6 weeks |
| Reactive vs Planned Ratio | Reactive work orders ÷ total work orders × 100 | High reactive share signals PM and planning breakdowns | < 20% reactive |
| Parts Availability Rate | WOs completed without parts delay ÷ total WOs × 100 | Flags inventory gaps that stall scheduled work | > 92% |
| Unplanned Downtime % | Unplanned downtime hours ÷ total scheduled production hours × 100 | Direct measure of lost production caused by failures | < 5% |
| Safety Incident Rate | Recordable incidents × 200,000 ÷ total labor hours | Connects maintenance quality to workplace safety outcomes | Below industry average |
Turning KPIs Into Action on the Plant Floor
Measuring KPIs is only useful if the data changes how work gets planned and executed each week. Book a Demo to see how Oxmaint AI turns live KPI trends into automatic work order actions.
Build a Live KPI Dashboard
Connect work orders, PM schedules, and asset data into one dashboard so KPIs update automatically rather than through monthly manual rollups.
Set Asset-Level Targets
Apply MTBF, MTTR, and downtime targets per asset criticality tier rather than a single plant-wide number that hides high-risk equipment.
Review Trends Weekly
Weekly KPI reviews catch a slipping PM compliance rate or rising backlog ratio before it becomes a production-impacting failure.
Link KPIs to Root Cause
When MTTR rises, trace it back to parts delays, skill gaps, or diagnostic time rather than treating the symptom alone.
Benchmark Across Sites
Multi-plant operators should compare KPI performance across facilities to identify which sites need intervention and which practices to replicate.
How AI-Powered CMMS Automates KPI Tracking
Sensor and PLC feeds calculate availability, performance, and quality continuously instead of end-of-shift estimates.
AI analyzes vibration, temperature, and runtime trends to forecast failure probability ahead of breakdown.
Every scheduled PM is logged automatically, giving an always-current compliance percentage with no manual tally.
Labor, parts, and contractor costs roll up automatically against asset replacement value for instant benchmarking.
Mobile time logging captures actual hands-on hours versus travel, waiting, and admin time per technician.
Compare reliability and cost KPIs across every plant in one view to prioritize where reliability investment goes next.
Common KPI Tracking Mistakes to Avoid
Even well-intentioned KPI programs fail when the wrong metrics are prioritized or data quality is weak. Book a Demo to see how automated data capture eliminates most of these gaps.
Dashboards with 30+ KPIs dilute focus. Most plants get more value from 8–12 well-chosen, consistently tracked metrics.
Paper logs and spreadsheet rollups introduce delay and error, making KPIs a lagging rather than real-time signal.
A plant-wide average MTBF can hide a critical asset that is failing far more often than the number suggests.
KPIs that aren't reviewed by plant leadership rarely drive the resourcing decisions needed to move the needle.
KPI Benchmarking Best Practices for 2026
Standardize Definitions Plant-Wide
Ensure every site calculates MTBF, MTTR, and OEE the same way so cross-plant comparisons are accurate.
Automate Data Capture
Connect CMMS, sensors, and ERP systems so KPIs update from real activity, not periodic manual reporting.
Segment by Asset Criticality
Track reliability KPIs separately for critical, essential, and non-critical assets to focus resources correctly.
Review Weekly, Report Monthly
Use weekly operational reviews for course correction and monthly summaries for leadership reporting.
Tie KPIs to Budget Decisions
Use cost-as-% RAV and reactive ratio trends to justify staffing, parts inventory, and CMMS investment.
Benchmark Externally
Compare your plant's KPIs against published industry benchmarks annually to stay aligned with best practice.
See Every Maintenance KPI in One Dashboard
Oxmaint AI auto-calculates MTBF, MTTR, OEE, PM compliance, wrench time, and cost KPIs across every plant and asset.
Frequently Asked Questions
There is no single most important KPI — OEE, PM compliance, and MTBF together give the clearest picture of reliability and productivity. Book a Demo to see which KPIs matter most for your operation.
Most manufacturers target 85% OEE as world-class, with 60% considered typical and below 40% indicating significant improvement opportunity.
Operational KPIs like backlog ratio and schedule compliance should be reviewed weekly, while cost and reliability trends work well as monthly summaries.
Yes — a connected CMMS captures work order, labor, parts, and sensor data automatically, calculating KPIs in real time instead of manual spreadsheet rollups. Sign Up Free to see it running on your own asset data.
MTBF measures how often an asset fails between breakdowns, while MTTR measures how quickly the team restores it once a failure occurs. Both are needed together.
Ready to Benchmark Your Plant's Maintenance Performance?
Start your free Oxmaint AI trial and get a live KPI dashboard built from your existing assets and work orders.