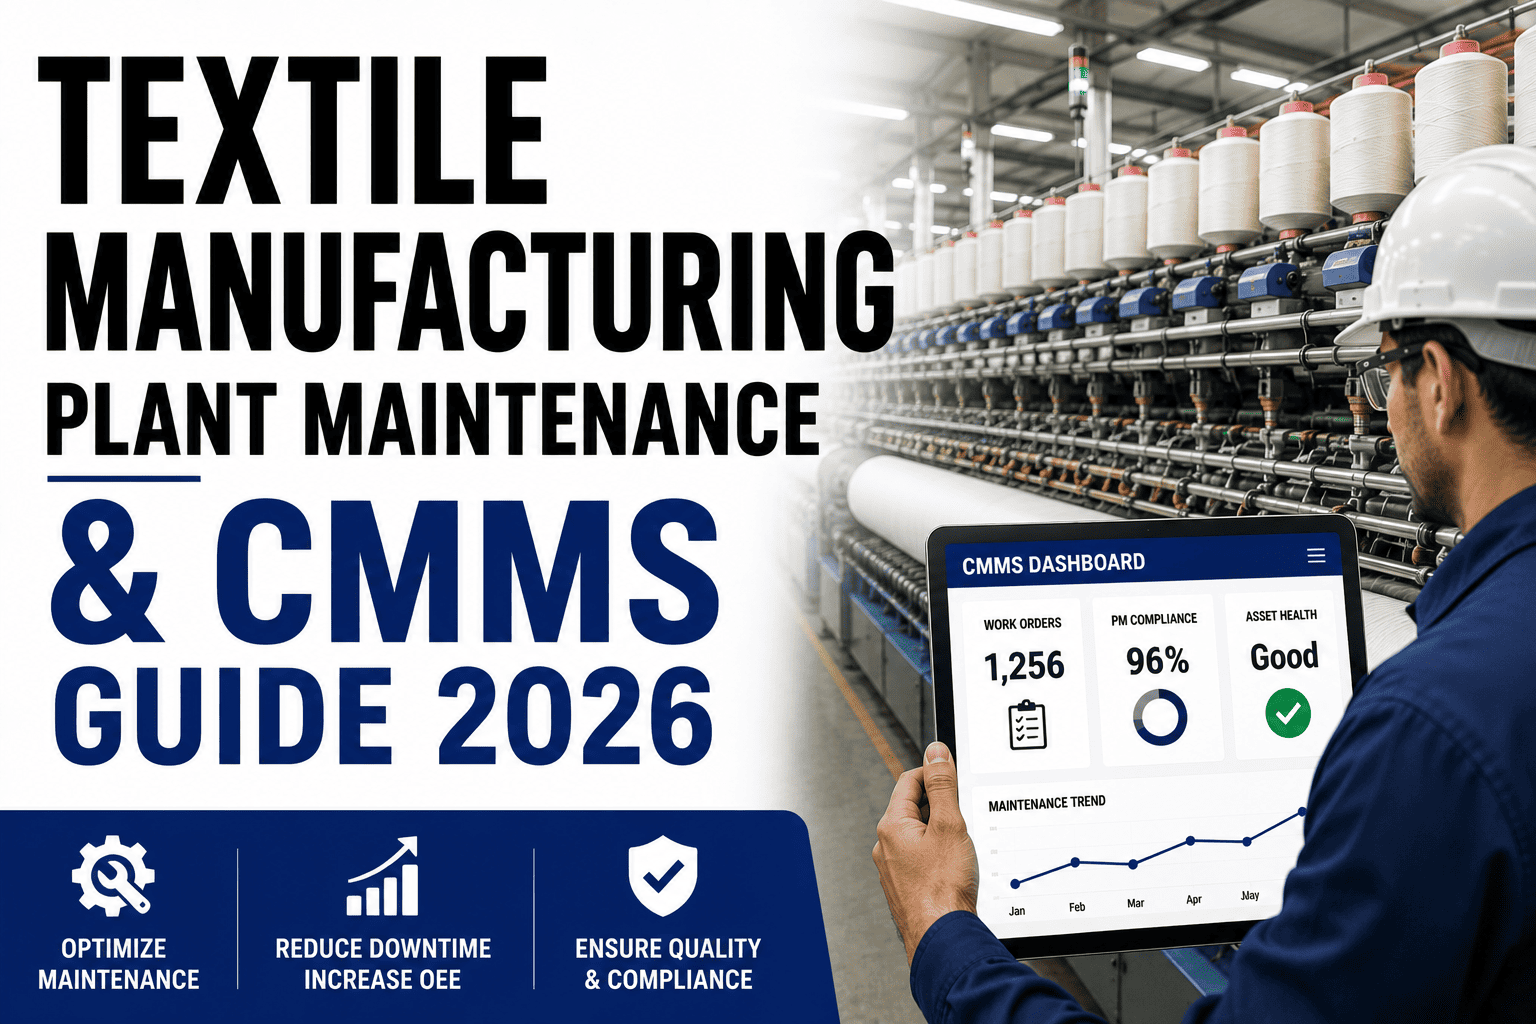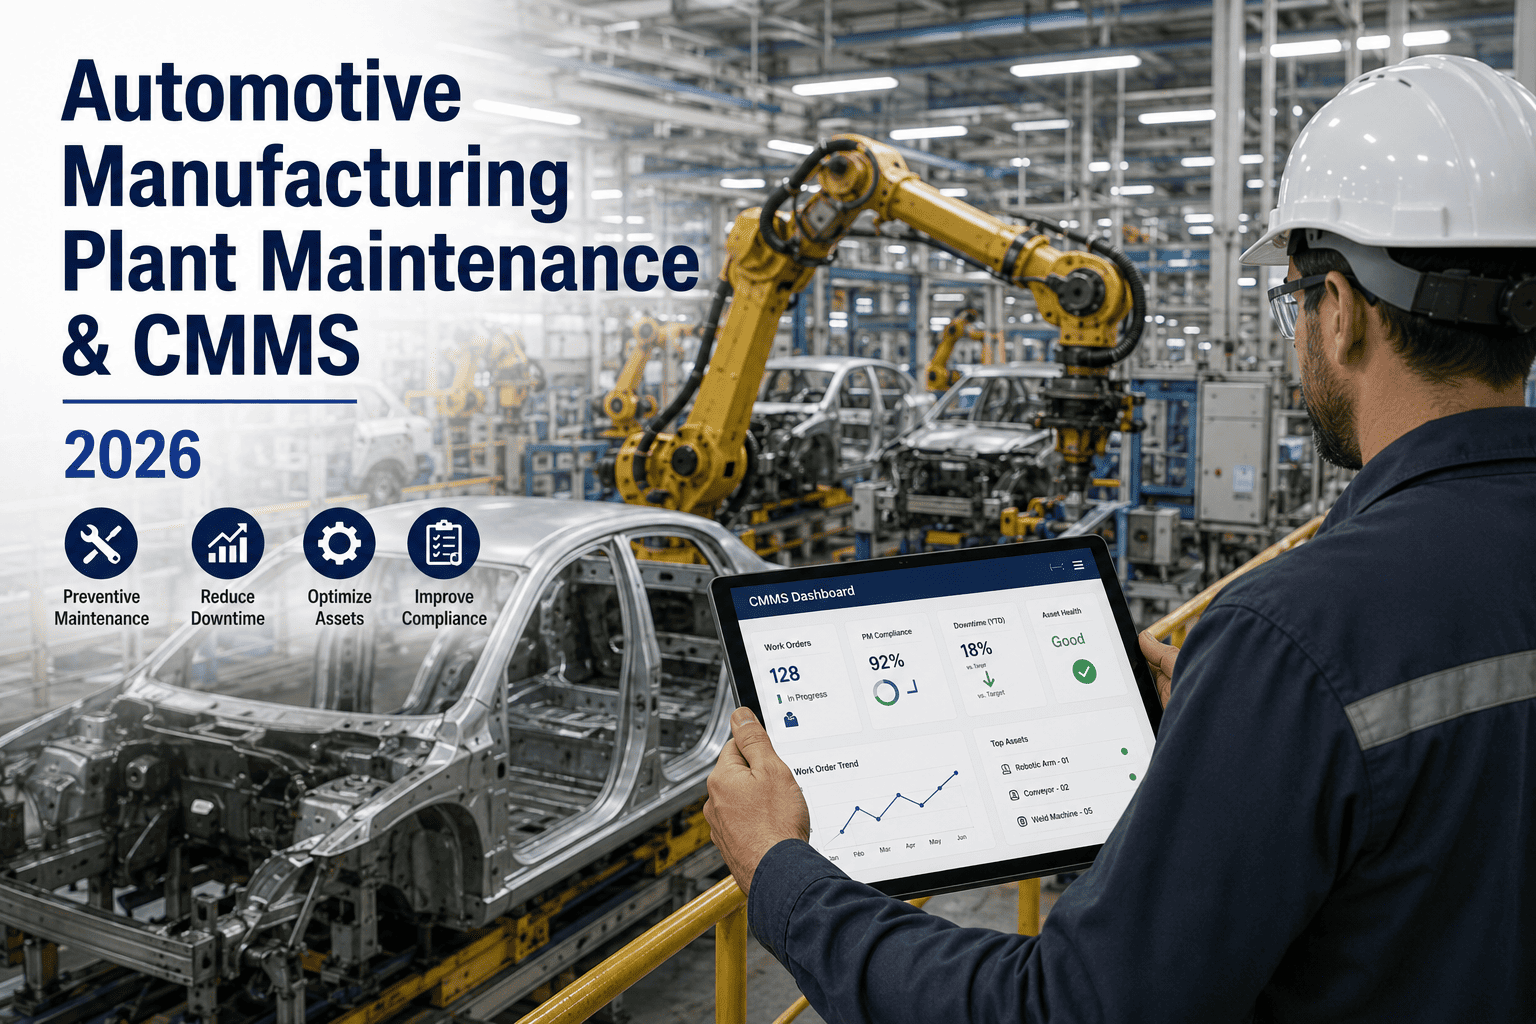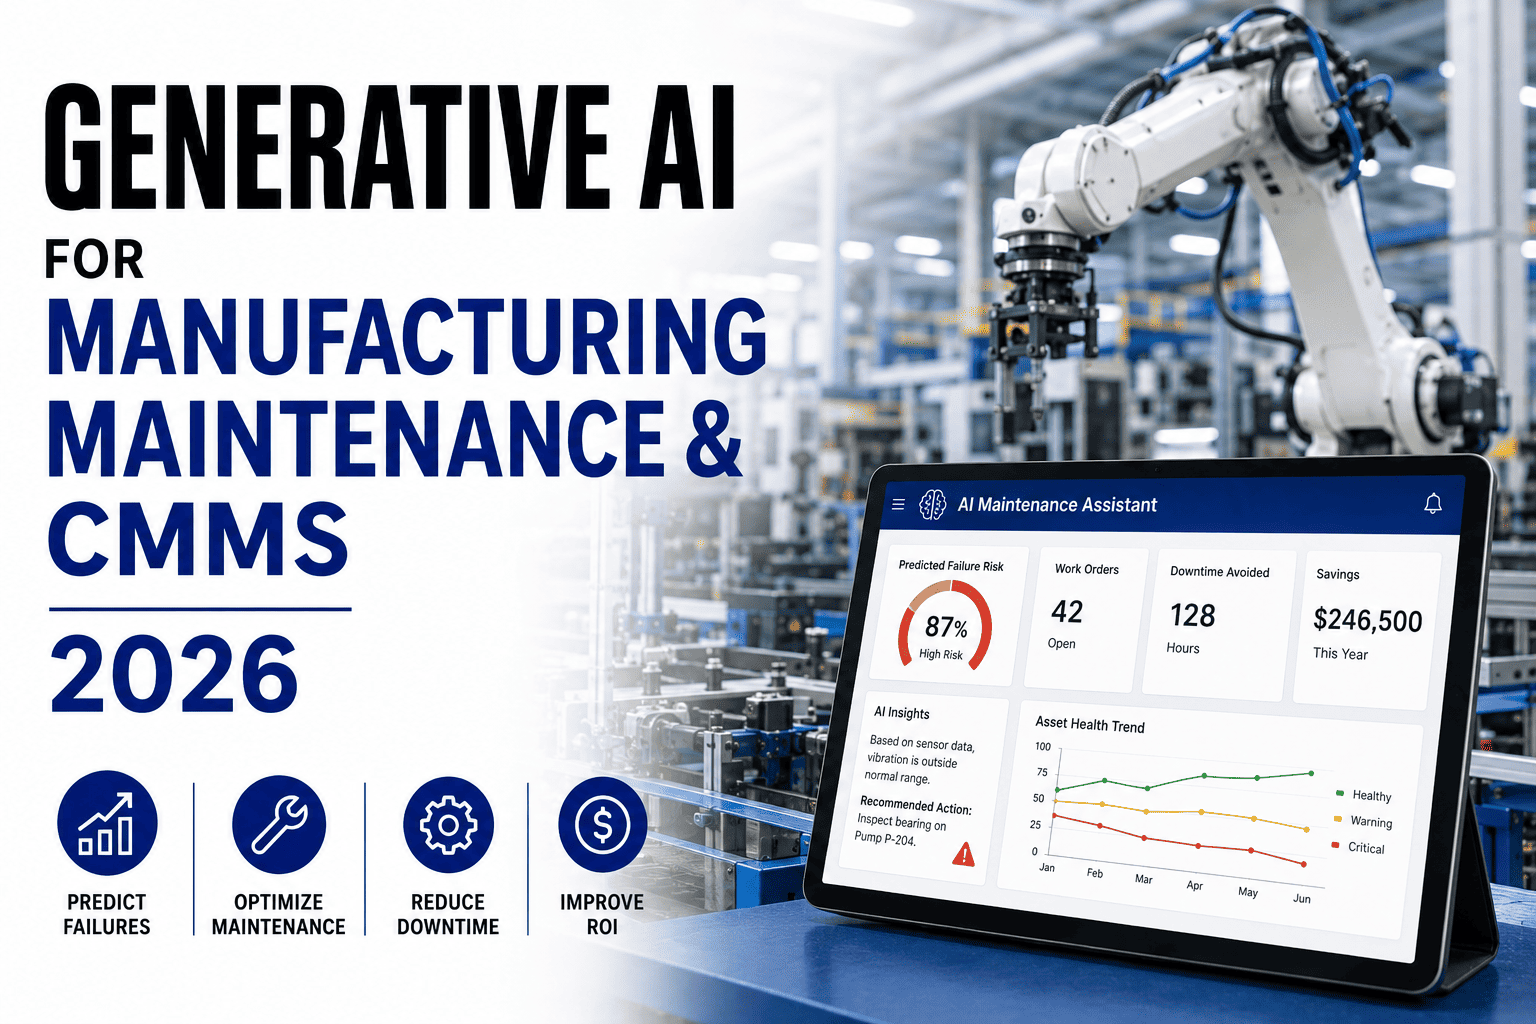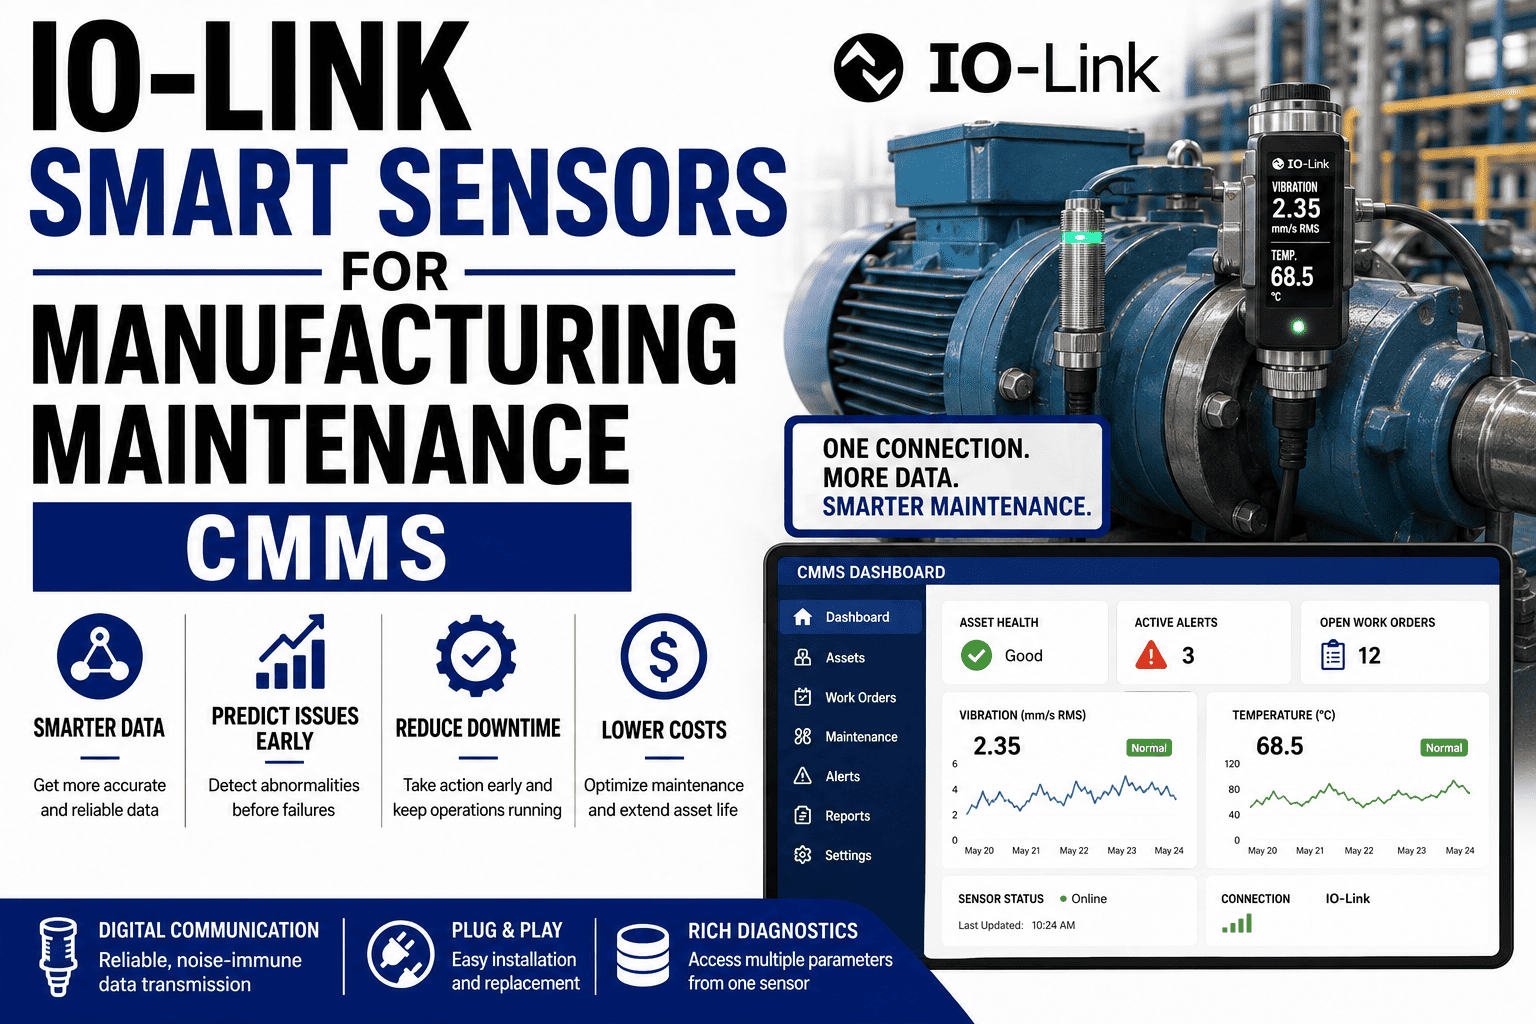
Smart factory maintenance ROI in 2026 is measured by the dollars saved through downtime avoidance, labor productivity gains, energy reduction, and quality improvements — not by the number of sensors you deploy. Manufacturing leaders who want CFO approval for a factory 4.0 transformation need airtight metrics that translate maintenance upgrades into hard financial outcomes. This guide breaks down the smart maintenance ROI metrics that matter most, benchmarks from real plants, and a framework for building a business case that gets funded. To see how OxMaint automates the data capture behind every number below, you can Start Free Trial in minutes — or keep reading to build your ROI model first.
2026 ROI BENCHMARK GUIDE
Quantify Every Dollar Saved by Smart Factory Maintenance
A 200-asset plant loses $1.4M–$2.8M per year to unplanned downtime. This guide shows you exactly which metrics to track, which formulas to use, and how to build a smart factory ROI business case your CFO approves on the first pass.
ROI FORMULAS
Smart Factory Maintenance ROI Metrics You Must Track in 2026
The Aberdeen Group reports that best-in-class manufacturers achieve 89% OEE versus 66% for laggards — an OEE gap worth millions. But you can't manage what you don't measure. Here are the four core formulas that translate maintenance activity into financial outcomes your finance team will accept.
Downtime Cost Avoidance
If a line generates $8,500/hour and you avoid 180 hours of downtime annually through predictive alerts, that's $1.53M in preserved revenue. This is the single largest line item in most manufacturing smart factory ROI models.
OEE Improvement Value
A 5-point OEE gain on a 6,000-hour/year asset at $8,500/hour equals $2.55M in additional throughput — without buying a single new machine. OxMaint tracks availability, performance, and quality in real time so this number is always live.
Maintenance Labor Savings
Cutting 25 minutes per work order through mobile dispatch, auto-parts kitting, and eliminated paper chase across 3,000 annual work orders at $52/hr saves $65,000/year in labor alone — plus overtime reductions of 15–22%.
Energy & Quality Loss Recovery
Poorly maintained motors consume 8–14% more energy. A plant running 400 motors can recover $45K–$90K/year in electricity plus $30K+ in scrap reduction when smart maintenance keeps equipment within spec.
PAYBACK ANALYSIS
Smart Factory Payback: What Does a CMMS Investment Return?
A typical mid-sized manufacturer (180 assets, 3 production lines) invests $18K–$35K/year in a smart CMMS platform like OxMaint. Below is a worked example showing where the savings come from and how fast they compound — benchmarked against Deloitte and McKinsey factory 4.0 data.
| ROI Category | Annual Savings | How OxMaint Delivers It |
|---|---|---|
| Downtime Avoidance (predictive alerts, PM compliance) | $480K – $1.2M | AI-driven failure prediction + automated PM scheduling |
| Labor Productivity (mobile work orders, no paper) | $55K – $95K | One-tap dispatch, digital checklists, photo capture |
| Spare Parts Inventory Optimization | $30K – $70K | Auto-reorder triggers, min/max analytics, usage tracking |
| Energy & Scrap Reduction | $40K – $85K | Condition monitoring keeps assets within spec |
| OEE Throughput Gain (5–8 point lift) | $200K – $600K | Real-time OEE dashboard, bottleneck analytics |
| Total Annual Value | $805K – $2.05M | Investment: $18K – $35K/yr → ROI 23x–58x |
A Midwest automotive-components plant with 180 critical assets was spending $42K/year on reactive maintenance and losing 320 hours to unplanned downtime. After implementing OxMaint's predictive maintenance and automated PM scheduling, unplanned downtime dropped 41% in year one. Downtime avoidance alone returned $1.13M (320 hrs × $8,500/hr × 41%), plus $78K in labor savings and $52K in parts optimization — a total payback of 4.2 months on a $24K platform investment. The maintenance transformation ROI was so clear the CFO expanded the rollout to all three plants before year-end.
OXMAINT CAPABILITIES
How OxMaint Maximizes Your Smart Factory Maintenance ROI
Every ROI metric above depends on one thing: accurate, real-time maintenance data. OxMaint's AI-powered CMMS and EAM platform automates data capture, predicts failures before they happen, and gives you the dashboards your CFO needs to see the savings — all in one system.
Predictive Maintenance Engine
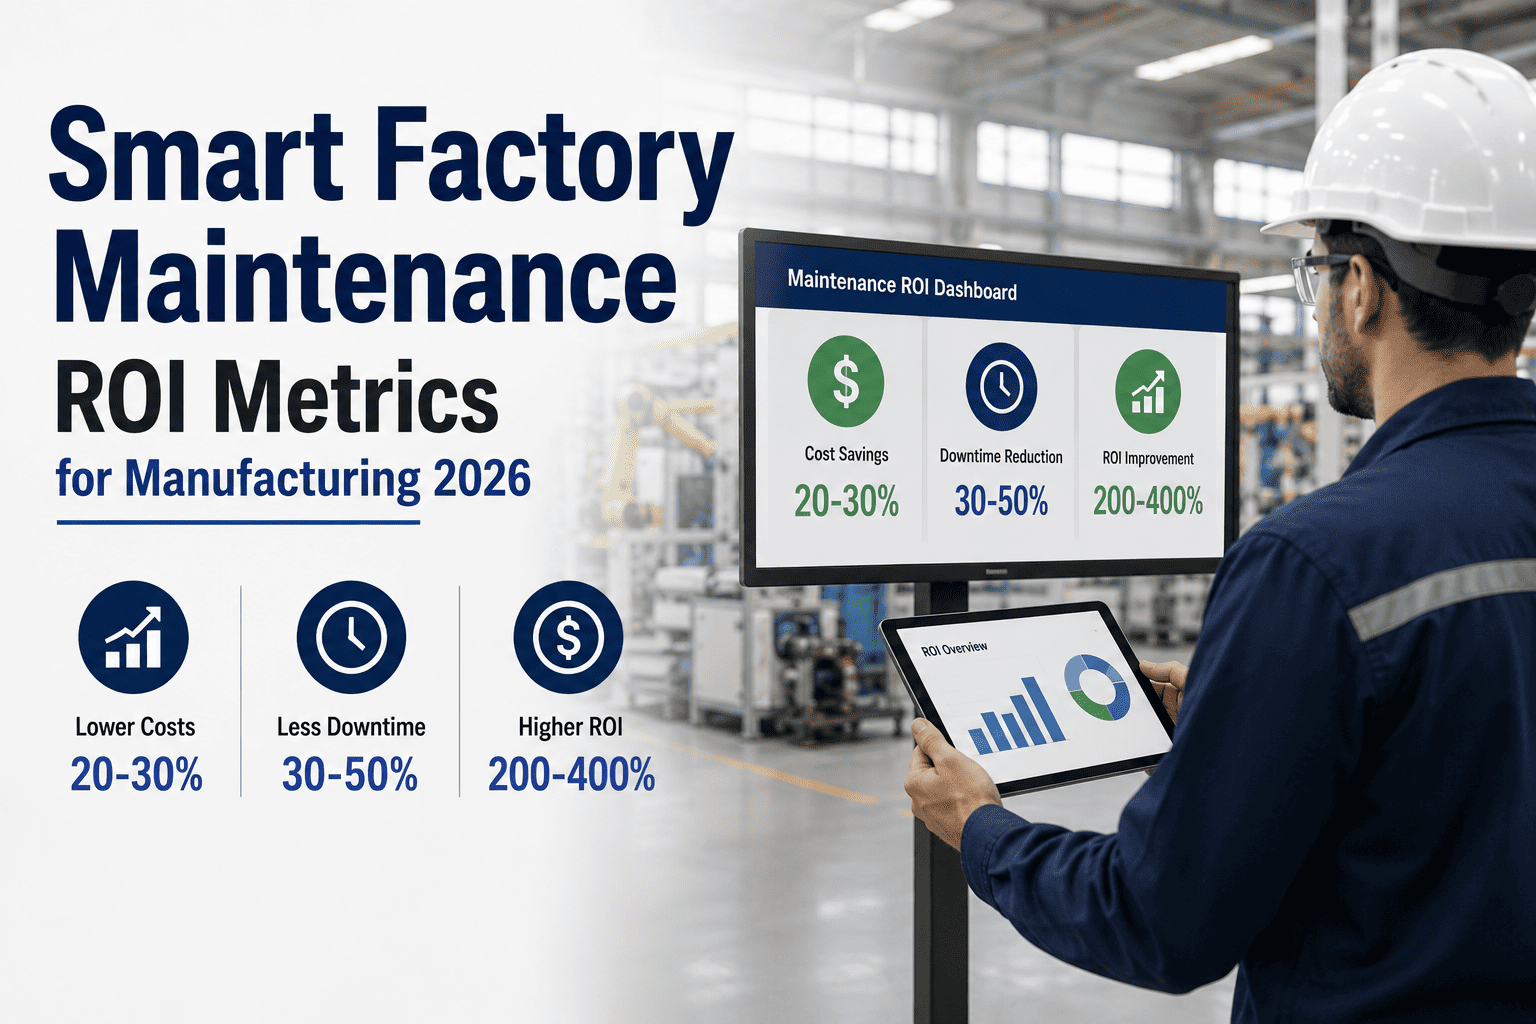
AI analyzes vibration, temperature, and run-time data to flag failures 5–21 days before they happen — cutting unplanned downtime 30–50% and extending asset life by 12–20%.
Digital Work Orders & PM Automation
Eliminate paper work orders and spreadsheet PM trackers. Mobile dispatch, auto-generated checklists, and photo capture cut work-order completion time by 25–40%.
Real-Time OEE & Cost Analytics
Live dashboards track OEE, MTBF, MTTR, and maintenance cost-per-unit — so you can prove ROI to leadership in real time, not in a month-end spreadsheet export.
Spare-Parts Inventory Intelligence
Auto-reorder triggers and usage analytics reduce critical-parts stockouts by 60–80% while cutting total inventory carrying costs 15–25% — no more rush orders at 2 AM.
BUILD THE BUSINESS CASE
Manufacturing ROI Metrics 2026: A Step-by-Step CFO-Ready Framework
Most smart factory proposals get rejected not because the savings aren't real, but because the business case lacks structure. Here's the 5-step framework that maintenance leaders use to win budget approval — backed by ISO 55000 asset-management principles and real payback data.
Baseline Current-State Costs
Pull 12 months of downtime logs, maintenance labor hours, parts spend, and energy bills. Tag every cost by asset and failure mode. Most plants discover their true reactive-maintenance cost is 2.5–4x what they budgeted.
Model the Savings by Category
Apply industry-benchmark percentages: 30–50% downtime reduction, 15–25% inventory reduction, 20–30% labor productivity gain. Be conservative — use the low end. CFOs respect restraint more than ambition.
Calculate Payback & NPV
Divide total investment (software + implementation + training) by first-year savings. Most CMMS deployments show 3–8 month payback. Run a 3-year NPV at your company's discount rate to show long-term compounding.
Map Risk of Inaction
Cost the do-nothing scenario: rising downtime, aging workforce knowledge loss, audit failures, energy waste. Quantify the risk of a single critical-asset failure ($50K–$500K per event). This is the number that moves CFOs.
Pilot, Prove, Scale
Start with one line or one plant for 90 days. OxMaint's free trial lets you instrument 50 assets and generate the before/after data that turns a pilot into a plant-wide rollout — no capital approval needed to start.
See OxMaint on Your Assets — Book a 30-Min Demo
Walk through a live smart factory maintenance dashboard configured for your plant. We'll map your top 10 assets to predictive alerts, PM automation, and ROI tracking — and show you the exact savings model your CFO will approve.
FREQUENTLY ASKED
Smart Factory Maintenance ROI — Your Top Questions Answered
What is the average ROI of smart factory maintenance in 2026?
Most manufacturers see a 23x–58x return on their CMMS investment within the first year, driven primarily by downtime avoidance ($480K–$1.2M for a 200-asset plant) and OEE improvements. The typical payback period is 4–8 months. Plants that pair predictive maintenance with automated PM scheduling see the fastest returns, often recovering the full platform cost in a single quarter. You can validate these numbers on your own assets when you Start Free Trial.
How do you calculate smart maintenance ROI for a manufacturing plant?
Smart maintenance ROI = (Total Annual Savings − Platform Cost) ÷ Platform Cost × 100. Savings come from four buckets: downtime avoidance (hours saved × revenue/hour), labor productivity (hours saved × labor rate), inventory optimization (carrying-cost reduction), and energy/scrap reduction. Baseline your current costs for 12 months, apply conservative improvement percentages, and divide total investment by first-year savings to get payback months.
How long does it take to see payback from a smart factory CMMS?
The typical CMMS payback period is 4–8 months. Plants with high downtime costs ($8K+/hour per line) and heavy reactive-maintenance burdens see payback in as little as 6–10 weeks because every hour of avoided downtime pays for weeks of software cost. The fastest payback comes from deploying predictive maintenance on your top 10–20 critical assets first, then scaling — which is exactly how OxMaint's phased rollout works.
What smart maintenance metrics should we report to the CFO?
Lead with four CFO-ready metrics: total downtime cost avoided ($), OEE improvement value ($), maintenance cost as a percentage of replacement asset value (target: under 2.5%), and work-order completion rate (target: 90%+ on-time). Supplement with MTBF, MTTR, and inventory turnover. OxMaint's analytics dashboard auto-generates all of these in real time — no manual spreadsheet work needed.
Is switching from spreadsheets to a smart CMMS worth it for a small plant?
Yes — even a 50-asset plant spending $15K/year on reactive maintenance and losing 80 hours to downtime can save $60K–$120K annually with a smart CMMS. Spreadsheet maintenance lacks PM automation, predictive alerts, and real-time analytics, which means failures go undetected and labor is wasted on paper chase. OxMaint's free 14-day trial lets you instrument your assets and see the before/after data before committing.
Start Measuring Your Smart Factory Maintenance ROI Today
Join hundreds of maintenance leaders who replaced reactive chaos with data-driven reliability. OxMaint deploys in days — not months — and your first ROI dashboard is live within the first week. Start free, or let us walk you through it.
Free 14-day trial · No credit card