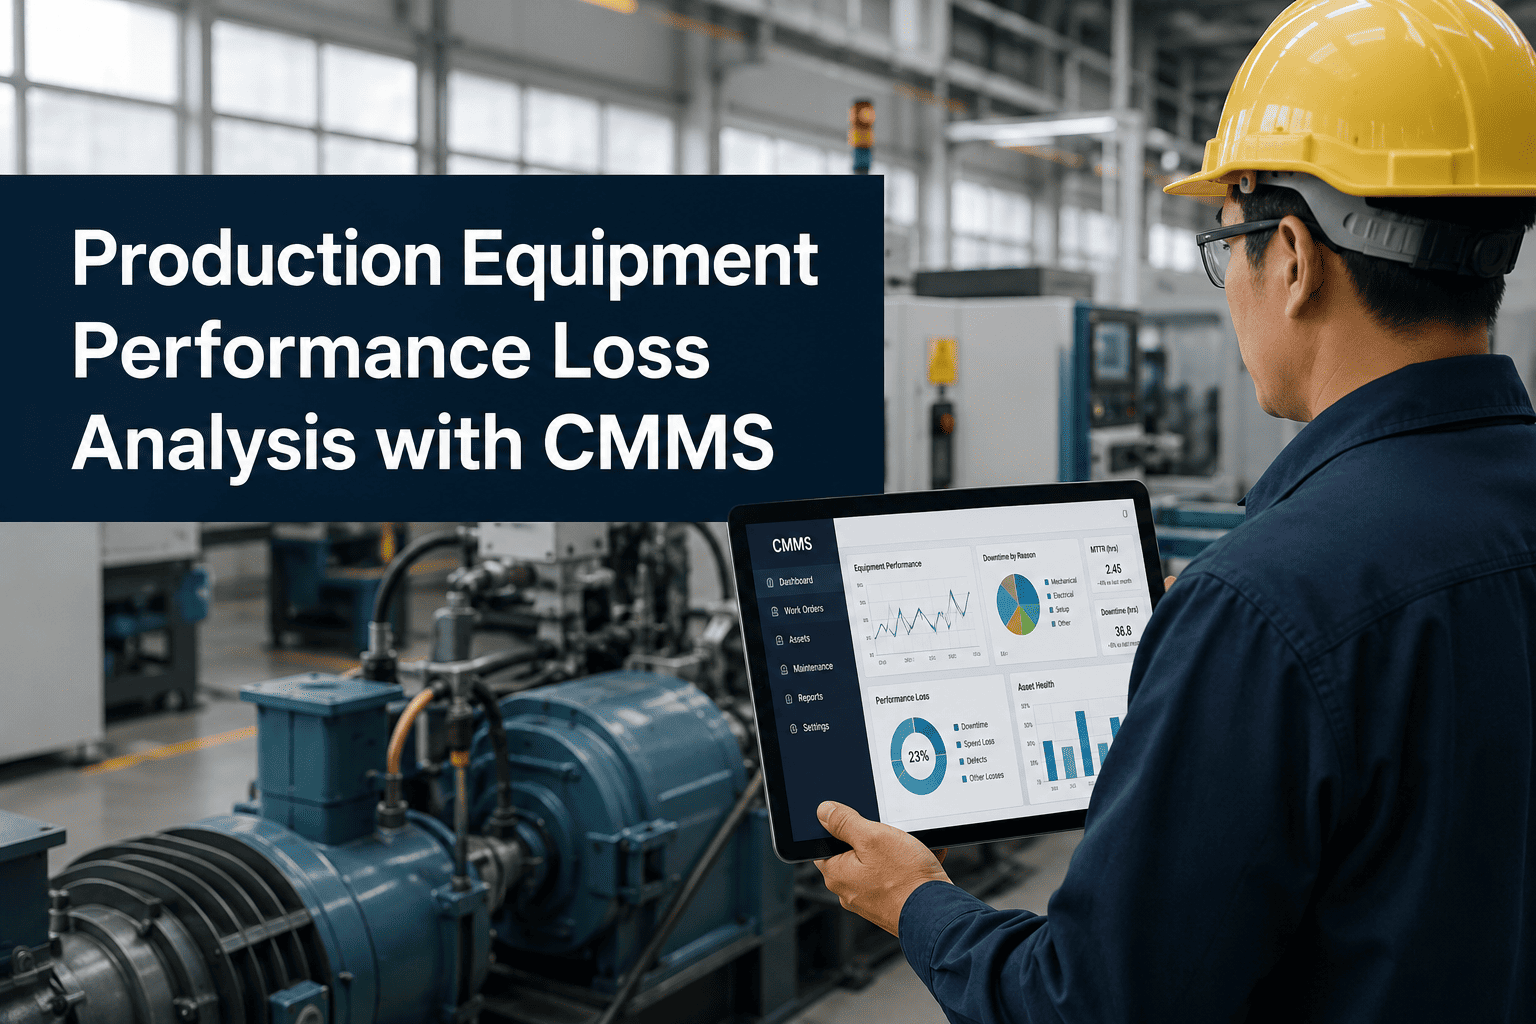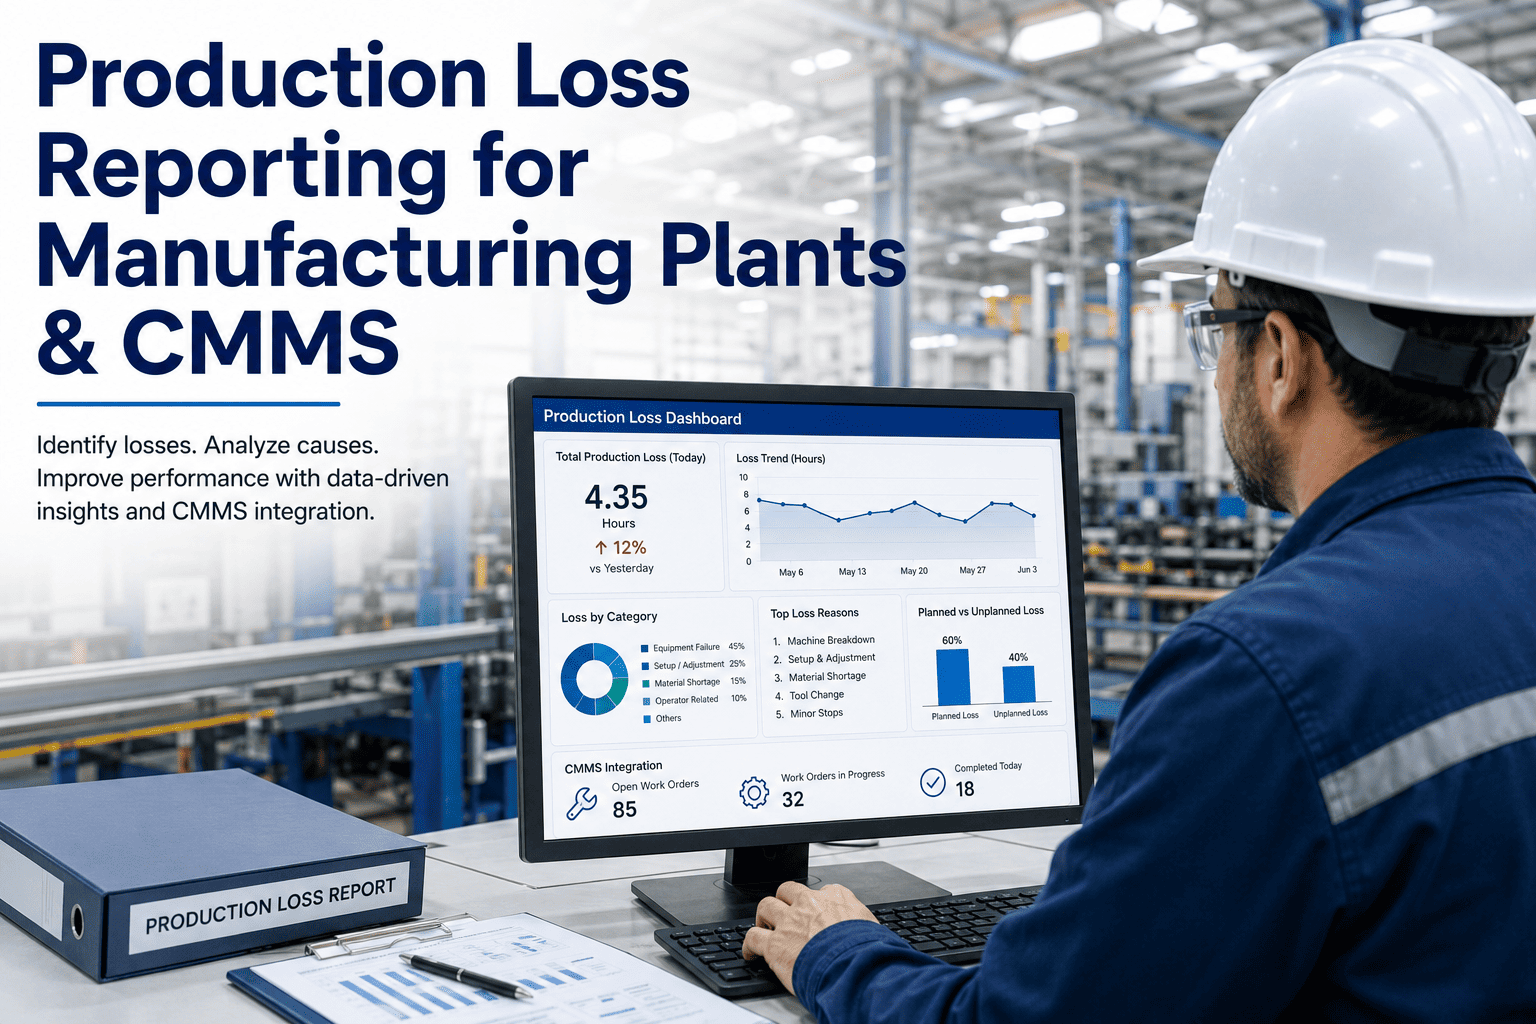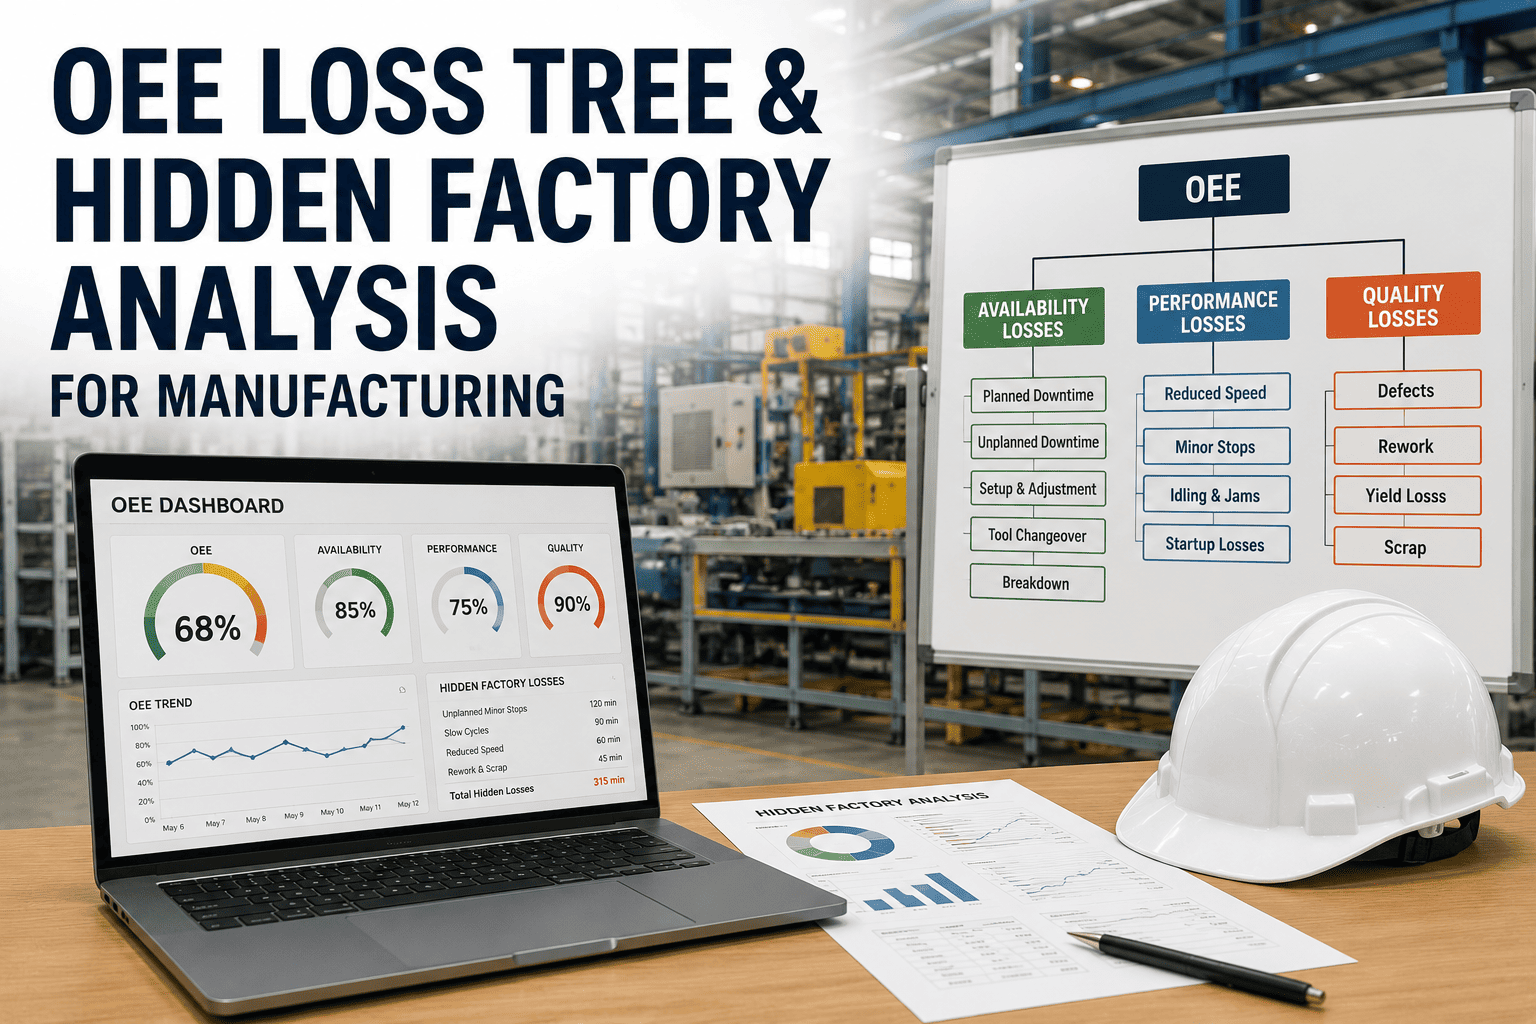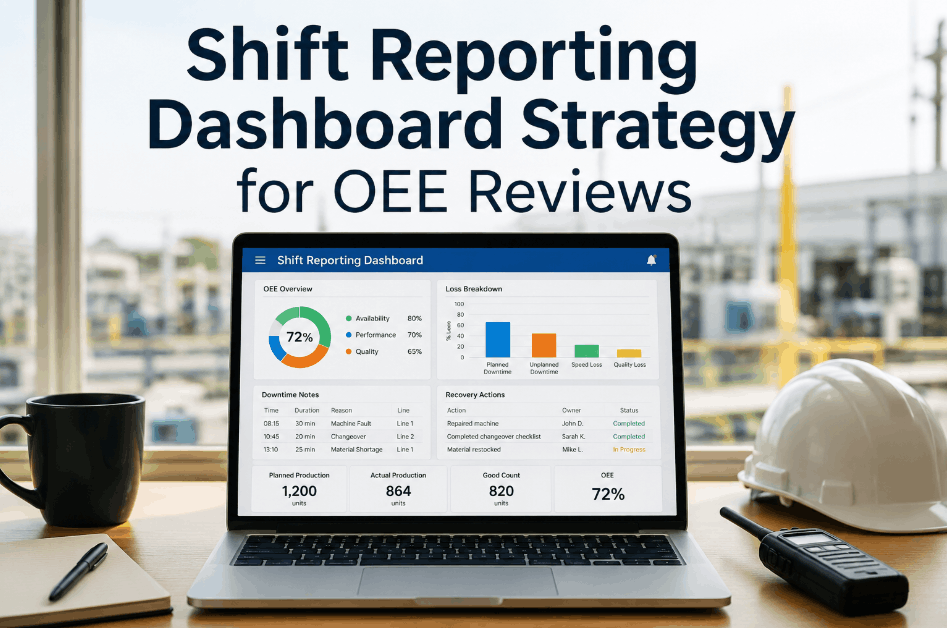
OEE is widely reported in manufacturing — but rarely broken down in a way that shift leaders can act on during the run. When availability loss, performance loss, and quality loss are aggregated into a single score without tracing where output disappeared, shift leaders have a metric without a map. Operations teams using Sign Up Free on OxMaint can access OEE analytics that decompose production efficiency into a shift-level waterfall — showing exactly how much output was lost to downtime, speed reduction, and defects during each run. A structured OEE waterfall breakdown turns a lagging KPI into a real-time shift management tool that connects loss identification with maintenance and production action before the shift ends.
Why OEE Scores Alone Don't Help Shift Leaders Improve Output
An OEE score of 68% tells a shift leader that 32% of potential output was lost — but not where, when, or why. Without a waterfall decomposition, shift leaders cannot distinguish availability losses from performance losses, or identify which quality events are driving scrap rates. Book a Demo to see how OxMaint breaks OEE into its availability, performance, and quality components at the shift level — giving production leaders the loss tree they need to manage output in real time.
Six Dimensions of an OEE Waterfall Breakdown for Shift Leaders
An effective OEE waterfall goes beyond availability, performance, and quality percentages. It connects loss event timing, duration, cause classification, and production impact into a shift-level view that drives corrective action before the next run begins. Sign Up Free on OxMaint to access OEE analytics that give your shift leaders the loss breakdown visibility they need to manage output systematically.
Availability Loss Decomposition
Availability loss is the most recoverable OEE component — but only when broken into unplanned downtime, planned downtime, and setup and adjustment losses separately. OxMaint captures downtime events with cause codes and duration data that allow shift leaders to distinguish equipment failure from changeover overruns and planned maintenance scheduling gaps.
Performance Loss and Speed Reduction Tracking
Performance losses — minor stops, micro-interruptions, and reduced speed runs — are the most underreported OEE category. Capturing speed deviations from ideal cycle time at the event level, rather than averaging them across the shift, reveals which assets and product runs are generating the hidden throughput gap between actual and attainable output.
Quality Loss and First-Pass Yield Linkage
Quality losses in OEE reflect defects and rework that consume production time without producing saleable output. Linking scrap and rework events to the specific run segments where they occurred reveals whether quality loss is concentrated at startup, mid-run, or changeover — each of which requires a different corrective intervention.
Loss Event Timing and Shift Pattern Analysis
OEE losses are not uniformly distributed across a shift. Mapping loss event timing reveals whether availability, performance, and quality losses concentrate at shift start, mid-shift, or end — exposing crew transition gaps, warmup reliability issues, and fatigue-linked performance degradation that aggregate OEE scores cannot show.
Loss Tree Ranking and Pareto Prioritization
Most OEE improvement potential sits in a small number of recurring loss events. OxMaint generates loss tree rankings that identify the top availability, performance, and quality contributors by frequency and duration — giving shift leaders and maintenance planners a Pareto-driven action list rather than a full waterfall report to interpret manually.
Shift-Level OEE Reporting and Handoff Intelligence
OxMaint generates shift-end OEE waterfall reports that give incoming shift leaders a structured picture of where the previous shift lost output — enabling informed handoffs that prevent loss events from repeating across shift boundaries and connecting production intelligence to maintenance scheduling decisions.
OEE Loss Profile Benchmarks by Line Type
OEE loss distribution — how much is availability versus performance versus quality — varies significantly by production line type and operating speed. Understanding your line's typical loss profile helps shift leaders focus OEE improvement efforts where the highest recovery potential exists. Book a Demo to explore how OxMaint tracks OEE waterfall data alongside maintenance work orders and shift logs in one platform.
| Line Type | Dominant OEE Loss Category | Typical OEE Range | Recovery Priority | OxMaint Maintenance Lever |
|---|---|---|---|---|
| High-Speed Packaging Lines | Performance loss (micro-stops, speed reduction) | 55–75% OEE | Performance Recovery | Minor stop event capture + speed deviation trending |
| CNC Machining Cells | Availability loss (setup time, unplanned downtime) | 60–80% OEE | Availability Recovery | Downtime cause coding + changeover work order tracking |
| Assembly Lines | Availability and quality loss (line stoppages, rework) | 50–70% OEE | Balanced Recovery | Loss event timing analysis + first-pass yield linkage |
| Continuous Process Lines | Availability loss (planned and unplanned outages) | 70–90% OEE | Availability Recovery | PM compliance tracking + downtime duration benchmarks |
| Food and Beverage Lines | Availability loss (sanitation, changeover, CIP cycles) | 45–65% OEE | Availability Recovery | Planned downtime categorization + shift-level waterfall reports |
How OEE Losses Compound Without Shift-Level Visibility
OEE losses that are not identified and addressed within the shift compound through the next run — repeated minor stops become accepted operating norms, unresolved availability gaps displace scheduled maintenance, and quality losses generate rework that consumes capacity in subsequent shifts. Book a Demo to see how OxMaint connects shift-level OEE loss data with maintenance work order scheduling to prevent loss event recurrence.
Building a Shift-Level OEE Waterfall Program with OxMaint
Configure OEE Loss Categories and Cause Code Libraries
Set up OxMaint with OEE loss categories — availability, performance, quality — and standardized cause code libraries for each production line. Consistent cause coding is the foundation of waterfall analysis that shift leaders can act on rather than interpret.
Capture Loss Events with Duration, Cause, and Timing Data
Log every downtime, minor stop, speed reduction, and quality event in OxMaint with cause code, duration, and shift timestamp. Structured event logging replaces manual shift notes with searchable, aggregatable OEE data that supports both real-time and trend analysis.
Generate Shift-Level OEE Waterfall Reports
Use OxMaint's OEE analytics to produce shift-end waterfall reports that show availability, performance, and quality loss contributions alongside the top loss events by duration and frequency. Give shift leaders the structured output they need for informed handoffs and immediate corrective action planning.
Link High-Frequency Loss Events to Maintenance Work Orders
Use OxMaint to connect recurring OEE loss events — particularly availability losses from repeated equipment failures — to preventive and corrective maintenance work orders. Closing the loop between loss data and work order execution is what turns OEE reporting into OEE improvement.
Track OEE Trends Across Shifts, Lines, and Equipment Classes
Use OxMaint's reporting dashboards to trend availability, performance, and quality loss contributions across shifts, production lines, and asset categories. Turn shift-level OEE data into governance-ready manufacturing KPI reports that support both production management and maintenance planning decisions.
Frequently Asked Questions: OEE Waterfall Breakdown for Shift Leaders
What is an OEE waterfall breakdown?
An OEE waterfall breakdown decomposes overall equipment effectiveness into its three loss components — availability, performance, and quality — and traces each to specific events, causes, and durations within the shift, giving leaders a structured view of where output disappeared rather than just how much was lost.
What is the difference between availability loss and performance loss in OEE?
Availability loss captures time when equipment was not running — unplanned downtime, changeovers, and planned maintenance. Performance loss captures time when equipment was running below ideal speed — minor stops, micro-interruptions, and reduced cycle rate. Both reduce output but require different corrective interventions.
How does OxMaint support OEE waterfall reporting for shift leaders?
OxMaint captures loss events by category and cause code, generates shift-level OEE waterfall reports, links high-frequency loss events to maintenance work orders, and tracks OEE trend data across lines and shifts — connecting loss visibility to scheduling action in one platform.
How often should OEE waterfall data be reviewed by shift leaders?
Shift leaders benefit from reviewing OEE waterfall data at mid-shift for real-time intervention and at shift end for handoff preparation. OxMaint automates both reporting layers so review is embedded in shift cadence without adding manual reporting overhead.
What is a loss tree in manufacturing OEE analysis?
A loss tree ranks the contributors to each OEE loss category by frequency and duration impact — showing shift leaders and planners which specific downtime causes, speed deviations, or quality events are responsible for the majority of output loss across the run.