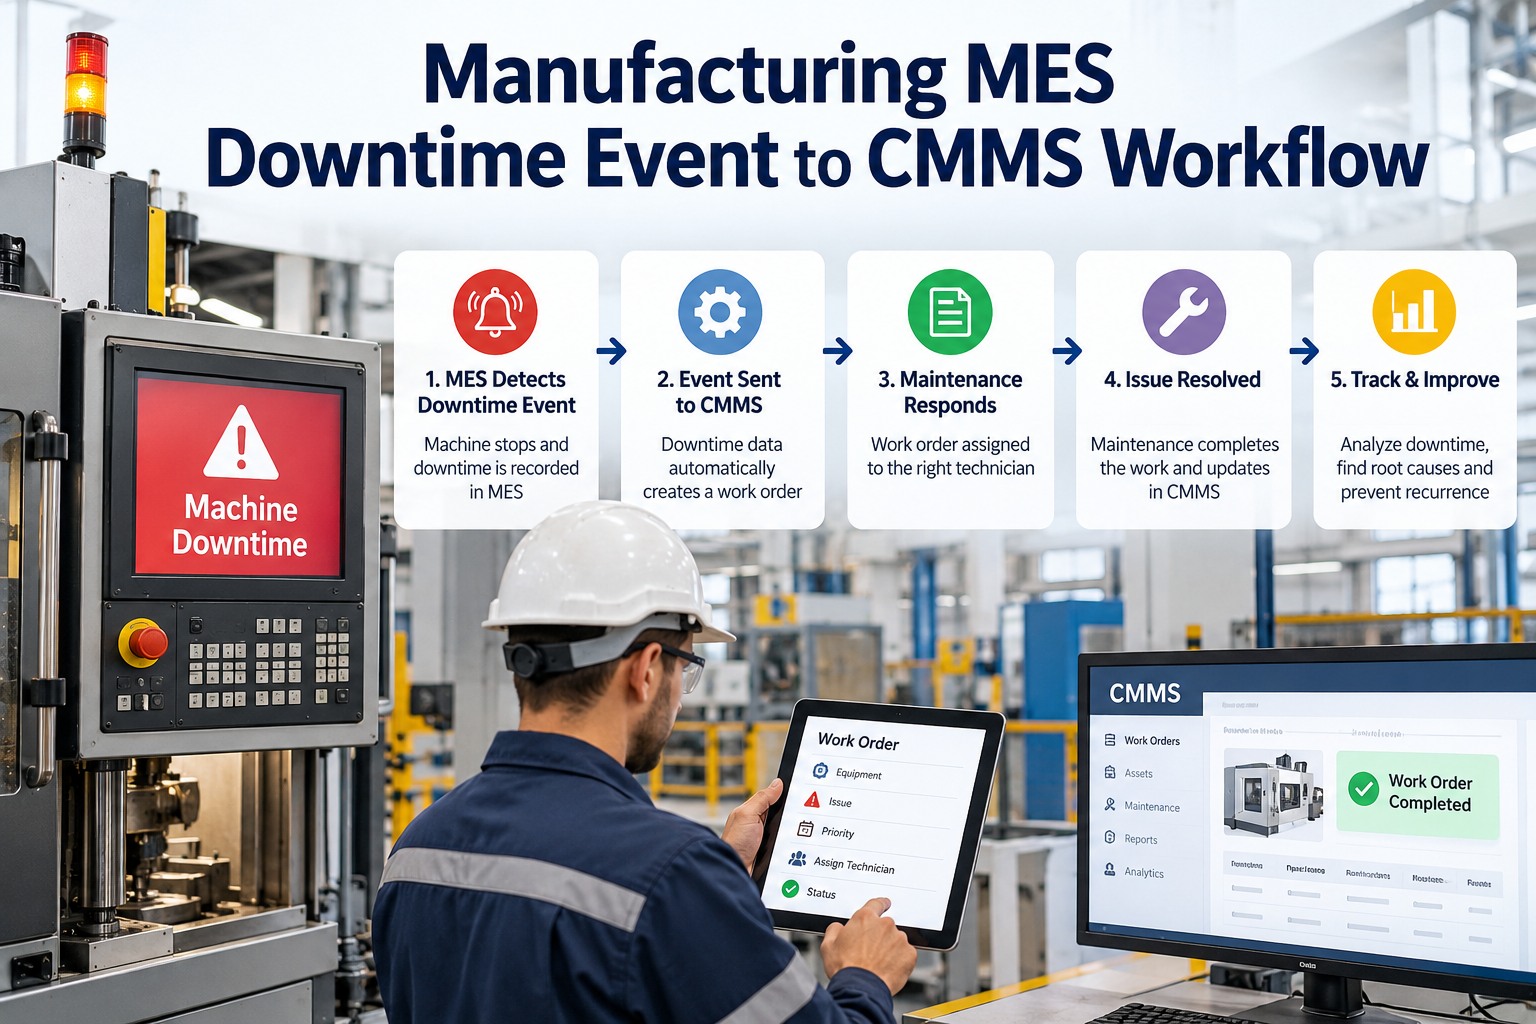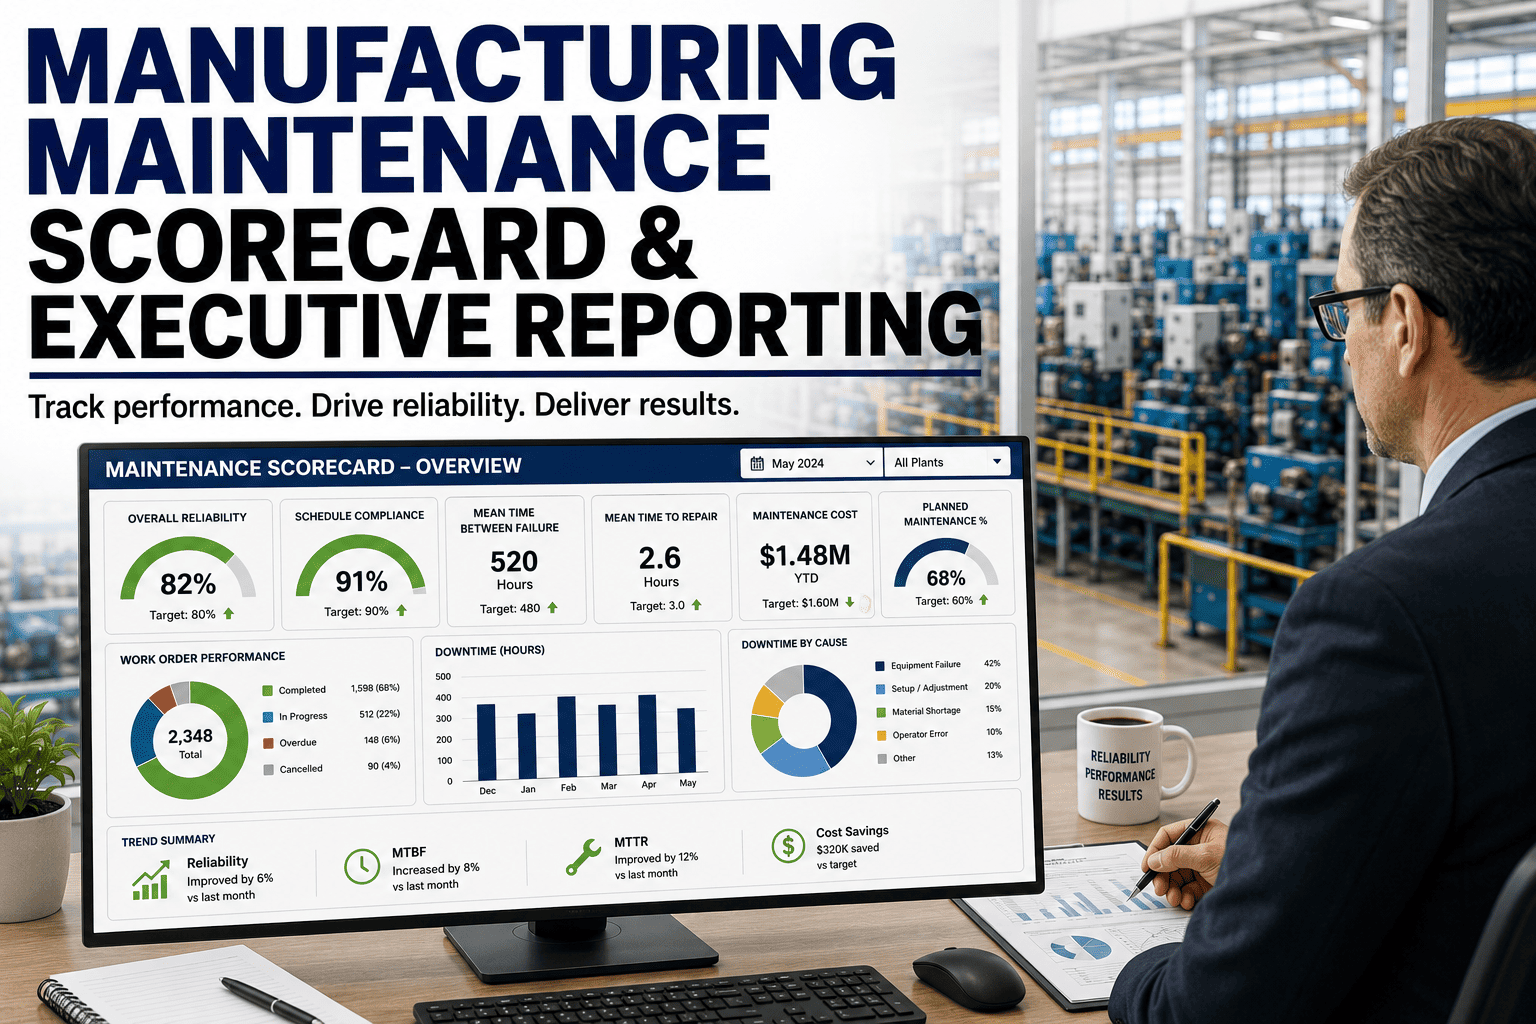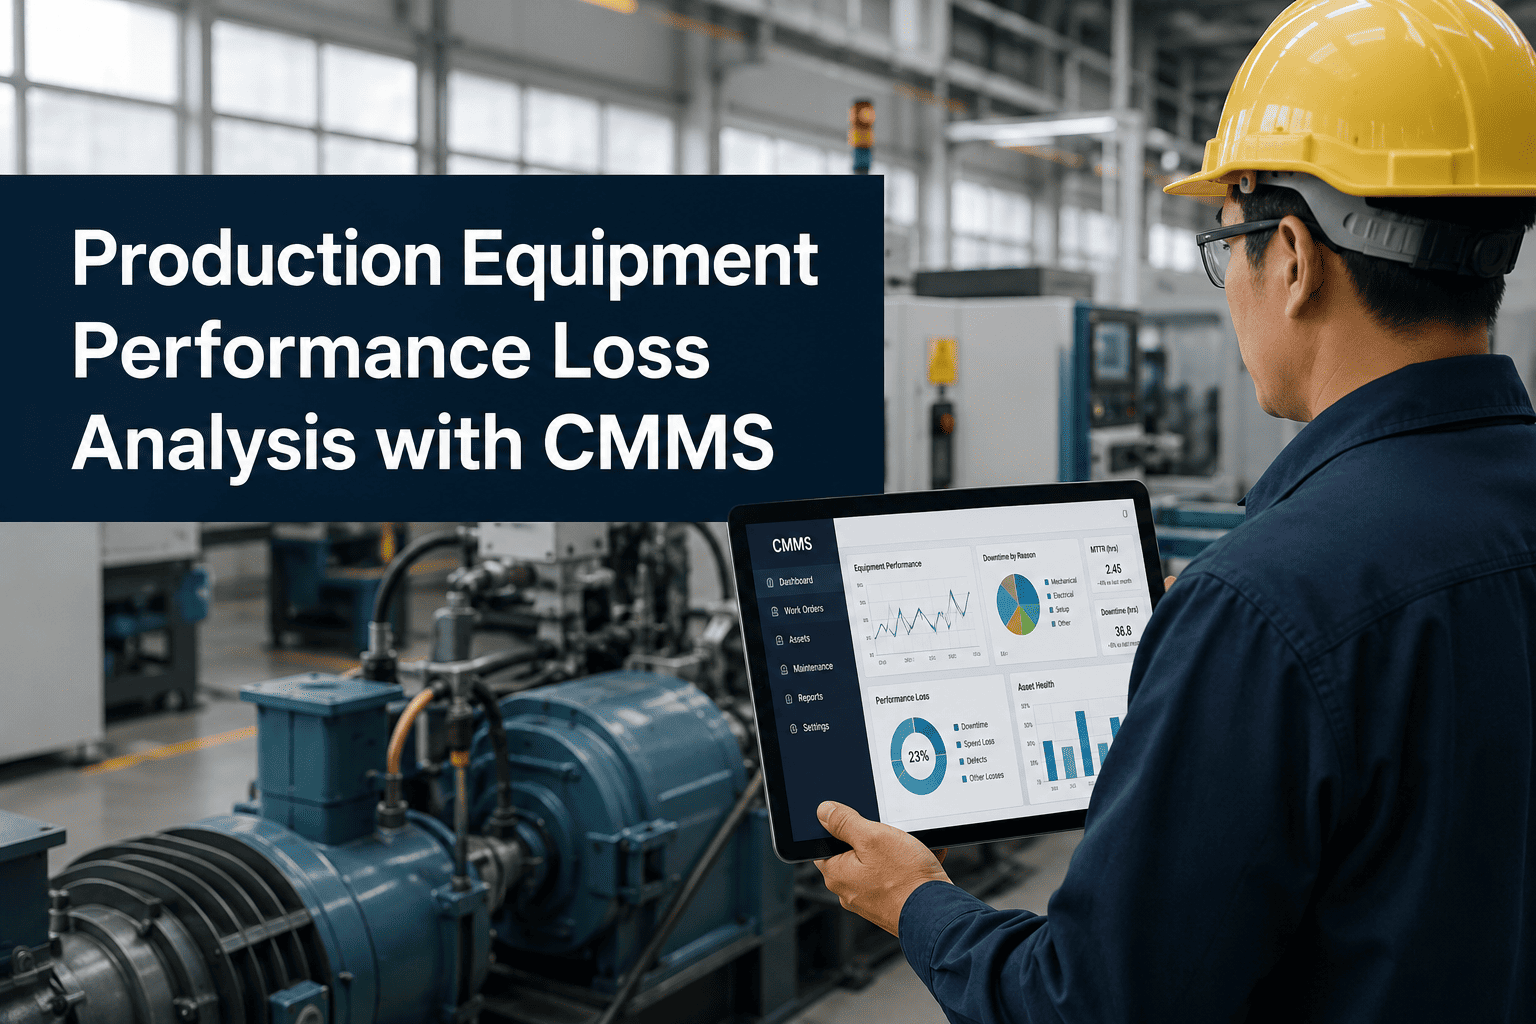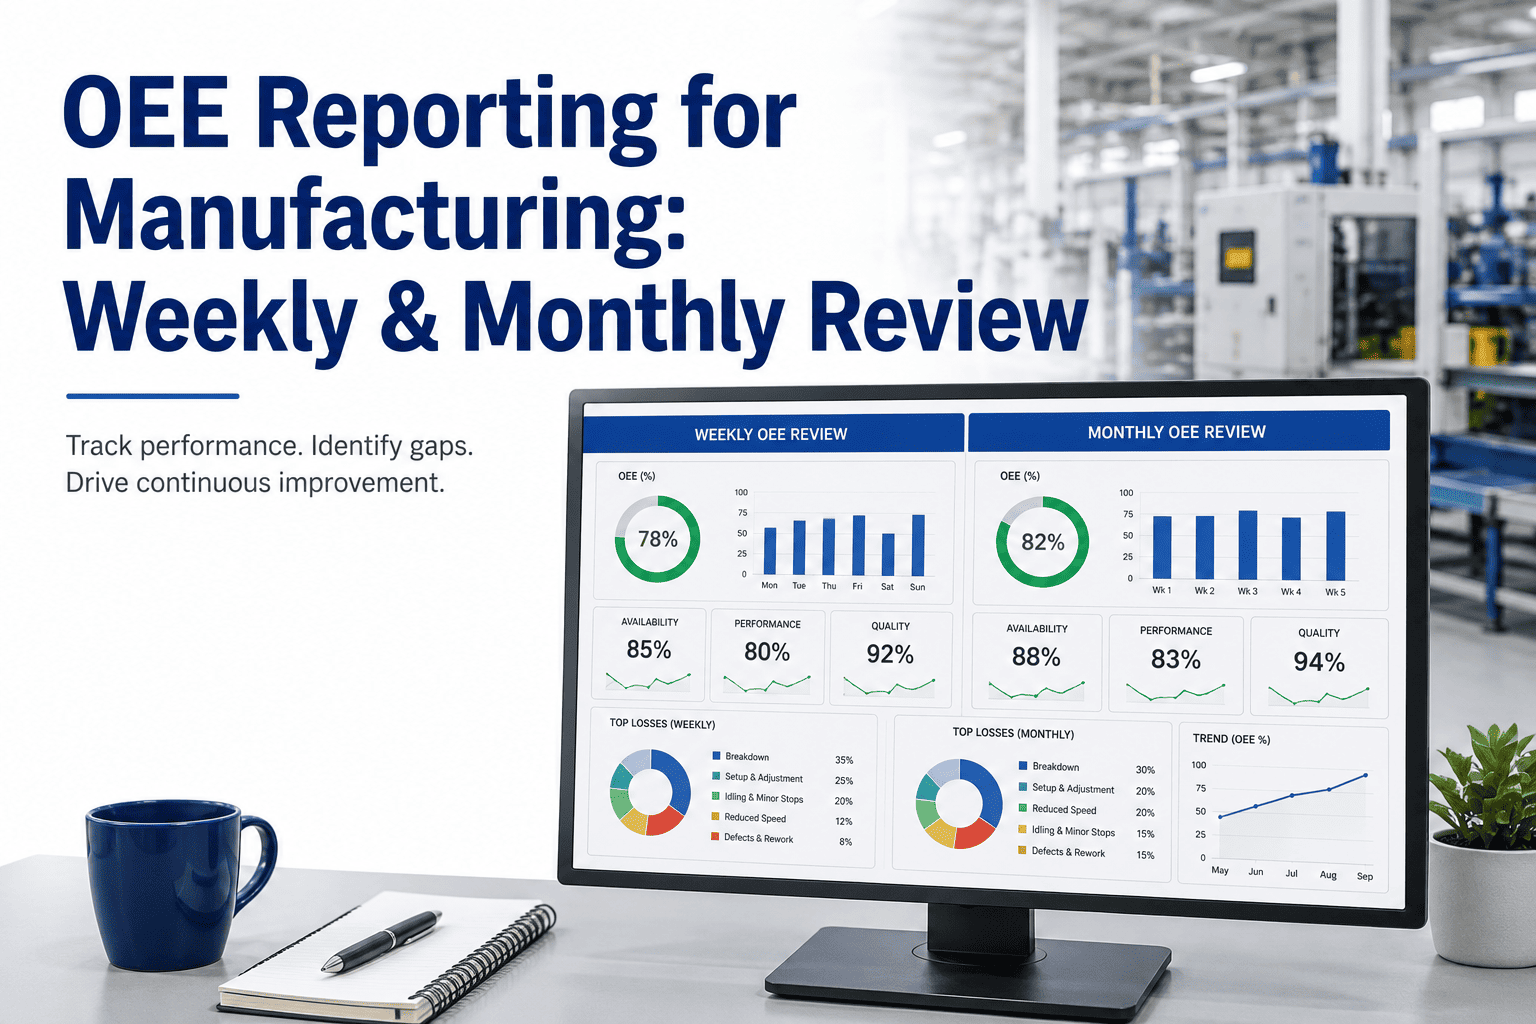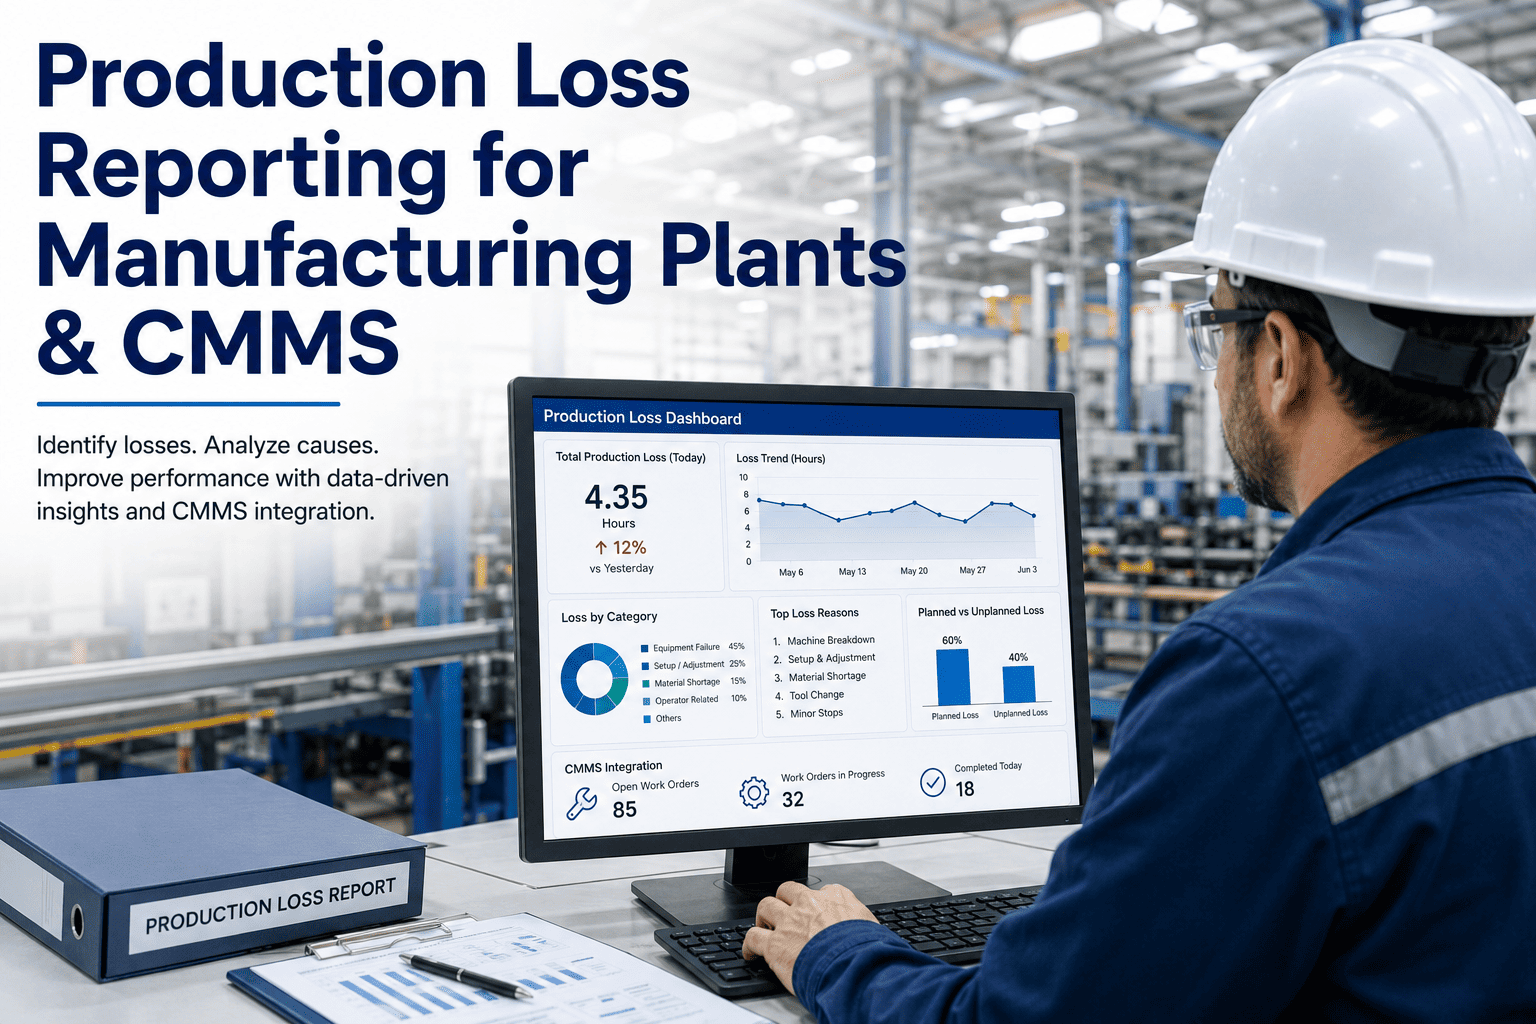
Production loss reporting is the discipline that converts every minute of stalled output into structured, analyzable data your improvement teams can actually act on. In most discrete and process plants, unplanned downtime accounts for 5–20% of available production time, yet less than a third of those losses are captured with enough granularity to drive root-cause action. This guide walks through loss code taxonomy, operator-driven entry at the source, CMMS-to-MES integration, shift-loss dashboards, and the upward reporting cadence that turns weekly reviews into prioritized improvement pipelines. Ready to standardize your loss data? Start Free Trial and configure your loss categories today.
How many downtime minutes become data your team can actually act on?
Most plants lose 5–20% of available production time to unplanned stops, yet fewer than 30% capture those losses with the granularity needed to fix the underlying cause. Standardized loss reporting changes that — turning every minute, every shift, every recurring failure into a prioritized, traceable, improvable data point.
A six-tier loss code taxonomy built on OEE pillars
ISO 22400 and TPM frameworks converge on six primary loss categories. A standardized two-level taxonomy — category plus cause code — lets operators classify a stop in under 15 seconds while giving engineers the depth they need for Pareto and Weibull analysis.
Equipment Failure
Unplanned mechanical, electrical or control-system breakdowns. Cause codes: bearing, drive, sensor, PLC fault, pneumatic leak.
AvailabilitySetup & Adjustment
Changeovers, die exchanges, recipe loading, first-article qualification. Tracked separately to isolate SMED improvement candidates.
AvailabilityIdling & Minor Stops
Brief interruptions under 5 minutes — jams, misfeeds, sensor trips. Often invisible in manual logs but responsible for 8–15% of throughput erosion.
PerformanceReduced Speed
Running below nameplate rate. Cause codes: worn tooling, viscosity drift, operator pacing, degraded motor, feedback loop instability.
PerformanceProcess Defects
Scrap and rework produced during steady-state running. Cause codes: temperature excursion, material variance, setup offset drift.
QualityStartup Yield Loss
Defects generated between cycle start and stable-state qualification. Distinct from changeover time — this is product lost, not minutes lost.
QualityQuantifying the cost of unstructured loss reporting
Consider a 180-asset food packaging plant running two shifts, five days a week, with an average product margin of $0.42 per unit and a target line rate of 120 units per minute. A single recurring filler-seal misalignment causes 14 minutes of unplanned stoppage per shift — but because operators log it only as "machine down," the pattern hides inside aggregate downtime for nine months.
14 min × 120 units/min × $0.42 = $705.60 per shift event
260 events × $705.60 × 1.4 recurring-cost factor = $256,838 annually
With standardized cause codes, that same filler-seal failure surfaces on the shift-loss dashboard within the first week — Pareto-ranked, trended, and routed to the reliability team with full duration, batch, and operator context. The fix (a revised seal-change PM and torque spec) typically pays back in under 45 days.
A four-month rollout from codes to closed-loop reporting
Plants that succeed with loss reporting treat it as a phased program, not a software switch. Each phase has a defined deliverable, owner, and exit criterion — typically reaching 90% entry compliance by the end of month three.
Code Design & Pilot Line
Define the six-category taxonomy, build 25–40 cause codes, and pilot on one high-impact line. Train three shift leads on entry workflow. Exit: 95% of stops coded within 24 hours.
Operator Rollout & Kiosks
Deploy tablet kiosks at each line and integrate stop-detection from PLCs. Target 60% of entries captured at the source within 5 minutes of event start. Exit: average entry latency under 8 minutes.
CMMS–MES Integration
Auto-create work orders from loss events exceeding 10 minutes. Feed production rate and downtime states into the CMMS for cross-referencing. Exit: 90% entry compliance, zero double-entry.
Shift-Loss Dashboard Go-Live
Launch the shift-loss dashboard with Pareto, trend, and recurring-cause views. Establish the weekly improvement review cadence. Exit: top-5 losses each have an assigned action with due date.
Connecting CMMS loss capture with production systems
The highest-value loss reports come from systems that talk to each other. When your CMMS receives automatic stop signals from the production line and reconciles them with operator entries, you eliminate the 30–40% of "phantom downtime" that never gets logged.
| Data Source | What It Provides | Integration Method | Latency Target |
|---|---|---|---|
| PLC / SCADA | Run state, cycle count, fault codes, speed | OPC-UA or MQTT broker | < 5 seconds |
| MES / ERP | Scheduled orders, target rates, BOM, shift plan | REST API or scheduled batch sync | < 60 seconds |
| Operator Tablet | Loss category, cause code, comment, action taken | CMMS mobile app, offline-capable | Real-time when online |
| CMMS Core | Asset hierarchy, PM history, work-order status | Native — loss record lives here | Immediate |
| Quality System | Scrap count, defect type, rework authorization | API push on batch close | Per batch / shift |
Auto-Triggered Work Orders
Loss events exceeding threshold duration or frequency auto-generate corrective WOs with full context — no manual handoff, no lost tickets.
OEE Reconciliation
Production rate data validates downtime entries, flagging mismatches where logged loss duration doesn't match actual line-state changes.
Real-Time Pareto
Shift-loss dashboards refresh live, so supervisors can spot an emerging failure mode before the shift ends — not at the next morning's review.
Shift-loss dashboards without the blame culture
The fastest way to kill a loss-reporting program is to use weekly meetings to interrogate operators about why a number is high. Effective plants reframe the review around patterns, not people — and the dashboard design does the heavy lifting.
Trend Over Single-Shift
Show 4-week rolling Pareto by cause code, not yesterday's worst line. Trends reveal systemic issues; single-day spikes trigger defensive responses and under-reporting.
Action Ownership, Not Blame
Every top-5 loss on the dashboard has an assigned owner and due date visible to the room. The question becomes "what's blocking the fix?" — not "who caused it?"
Recurring-Loss Alerts
Auto-flag cause codes appearing more than three times in seven days on the same asset. This shifts the conversation from reactive review to proactive escalation.
Cost-Weighted Ranking
Rank losses by annualized cost impact, not raw minute count. A 200-minute quality loss often outweighs a 600-minute availability loss once margin is applied.
"Within four months of standardizing our loss codes and connecting the CMMS to our line PLCs, we cut unplanned downtime by 23% and recovered roughly $310K in annualized throughput — without adding a single headcount."
— Reliability Lead, tier-1 automotive components plant (1,200 assets)
Turn every downtime minute into a data point your teams will act on
Configure your six-tier loss taxonomy, connect your CMMS to production systems, and launch a shift-loss dashboard your operators will actually use.
Production loss reporting, answered
How many loss cause codes should we start with?
Begin with 25–40 cause codes mapped to the six OEE categories. Too few codes hide patterns; too many cause operator fatigue and misclassification. Review code usage monthly and consolidate any code used less than 2% of the time into a broader bucket. You can Start Free Trial and import a starter taxonomy pre-built for discrete and process manufacturing.
What is the minimum data captured per loss event?
Every event needs six fields: asset ID, start timestamp, end timestamp (or duration), loss category, cause code, and free-text comment. Optional high-value fields include batch or order number, operator ID, action taken, and parts consumed. Capturing all six core fields takes under 15 seconds on a well-designed tablet form.
How does CMMS integration with production systems actually work?
The CMMS receives stop-state signals from PLCs via OPC-UA or MQTT, then prompts the operator to classify the event on a nearby tablet. The MES feeds order context, target rate, and shift schedule so the CMMS can auto-calculate production impact in units and dollars. No double-entry, no end-of-shift reconciliation.
How do we prevent weekly loss reviews from becoming blame sessions?
Lead with 4-week rolling trends instead of single-day spikes, assign a named owner and due date to every top-5 loss before the meeting, and frame the discussion around "what's blocking the fix?" rather than "who caused it?" You can see a live shift-loss dashboard built around this principle — Book a Demo and we'll walk you through it.
What compliance or standards frameworks reference production loss reporting?
ISO 22400 (KPIs for manufacturing operations), ISO 55000 (asset management), and TPM/Lean frameworks all require structured loss capture. For regulated industries, FDA 21 CFR Part 11 and EU GMP Annex 11 add electronic-record and audit-trail requirements that a compliant CMMS loss module satisfies natively.
Standardize your loss data this quarter
Deploy a six-tier loss taxonomy, connect your PLCs and MES, and give your reliability team the dashboards they've been asking for.
Free 14-day trial · No credit card