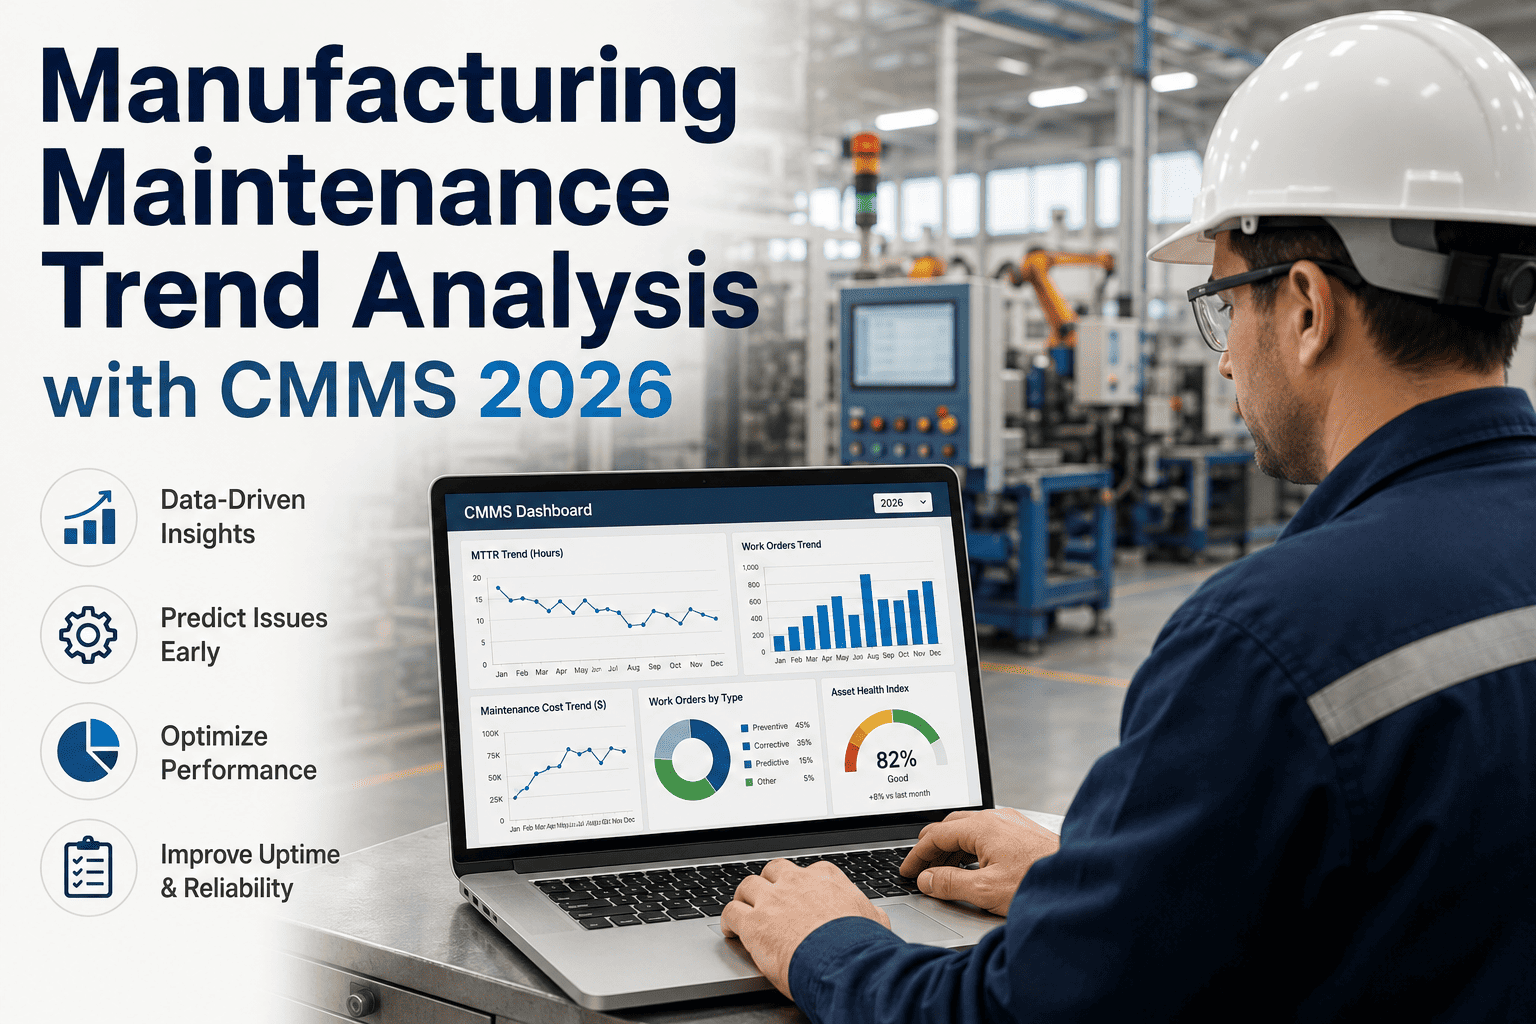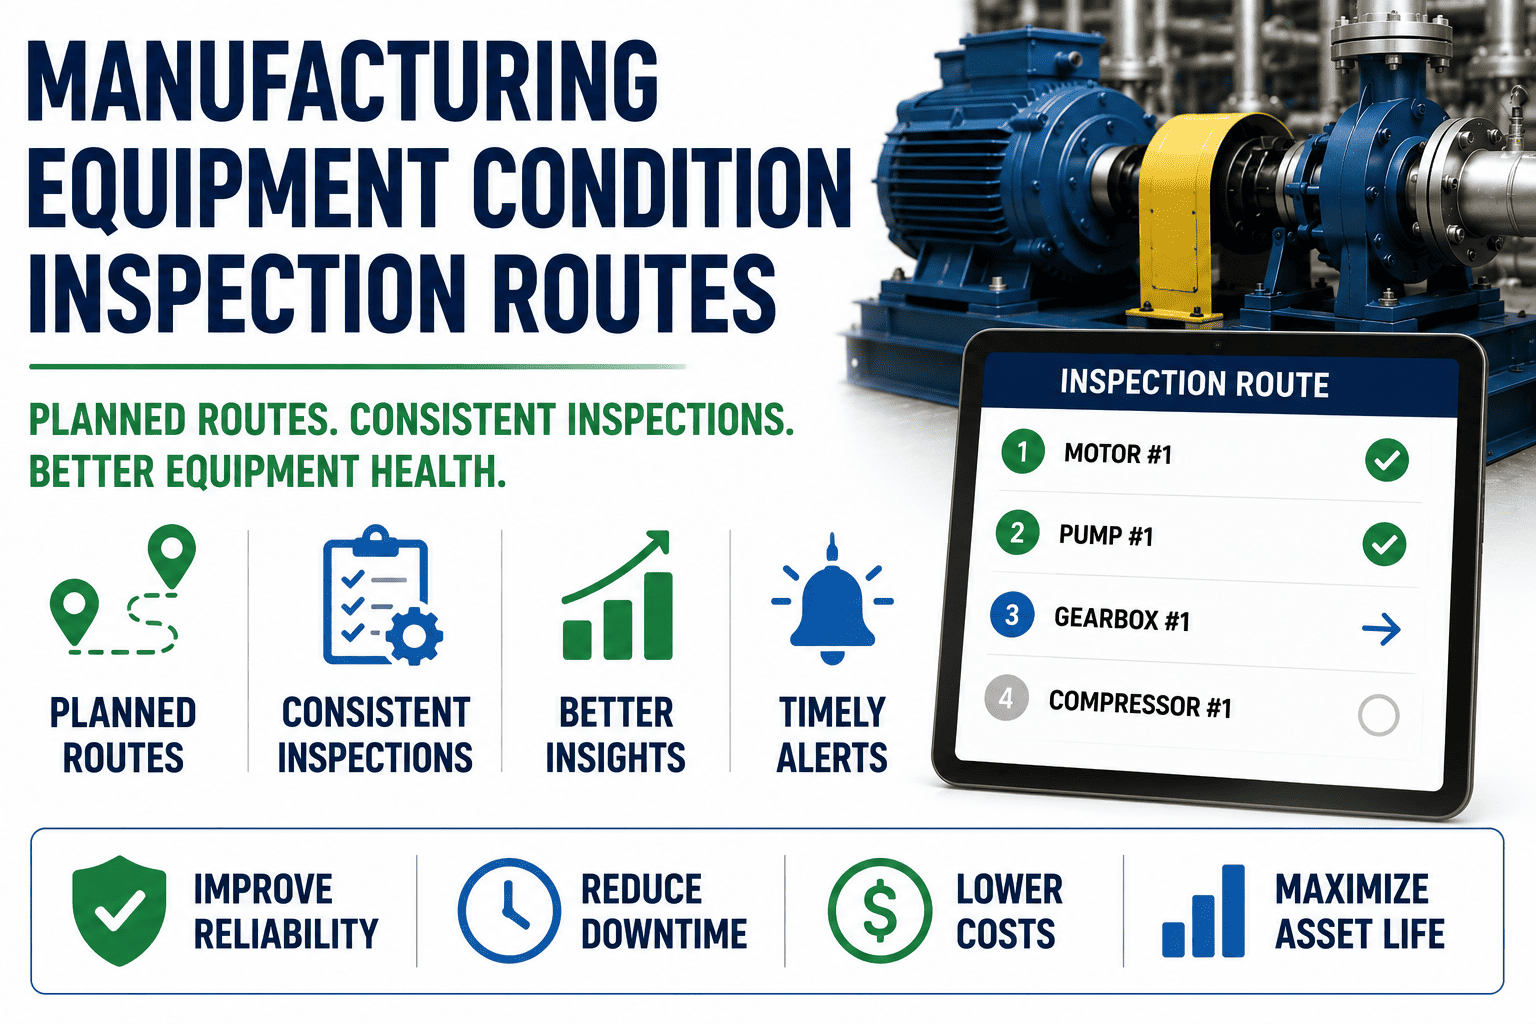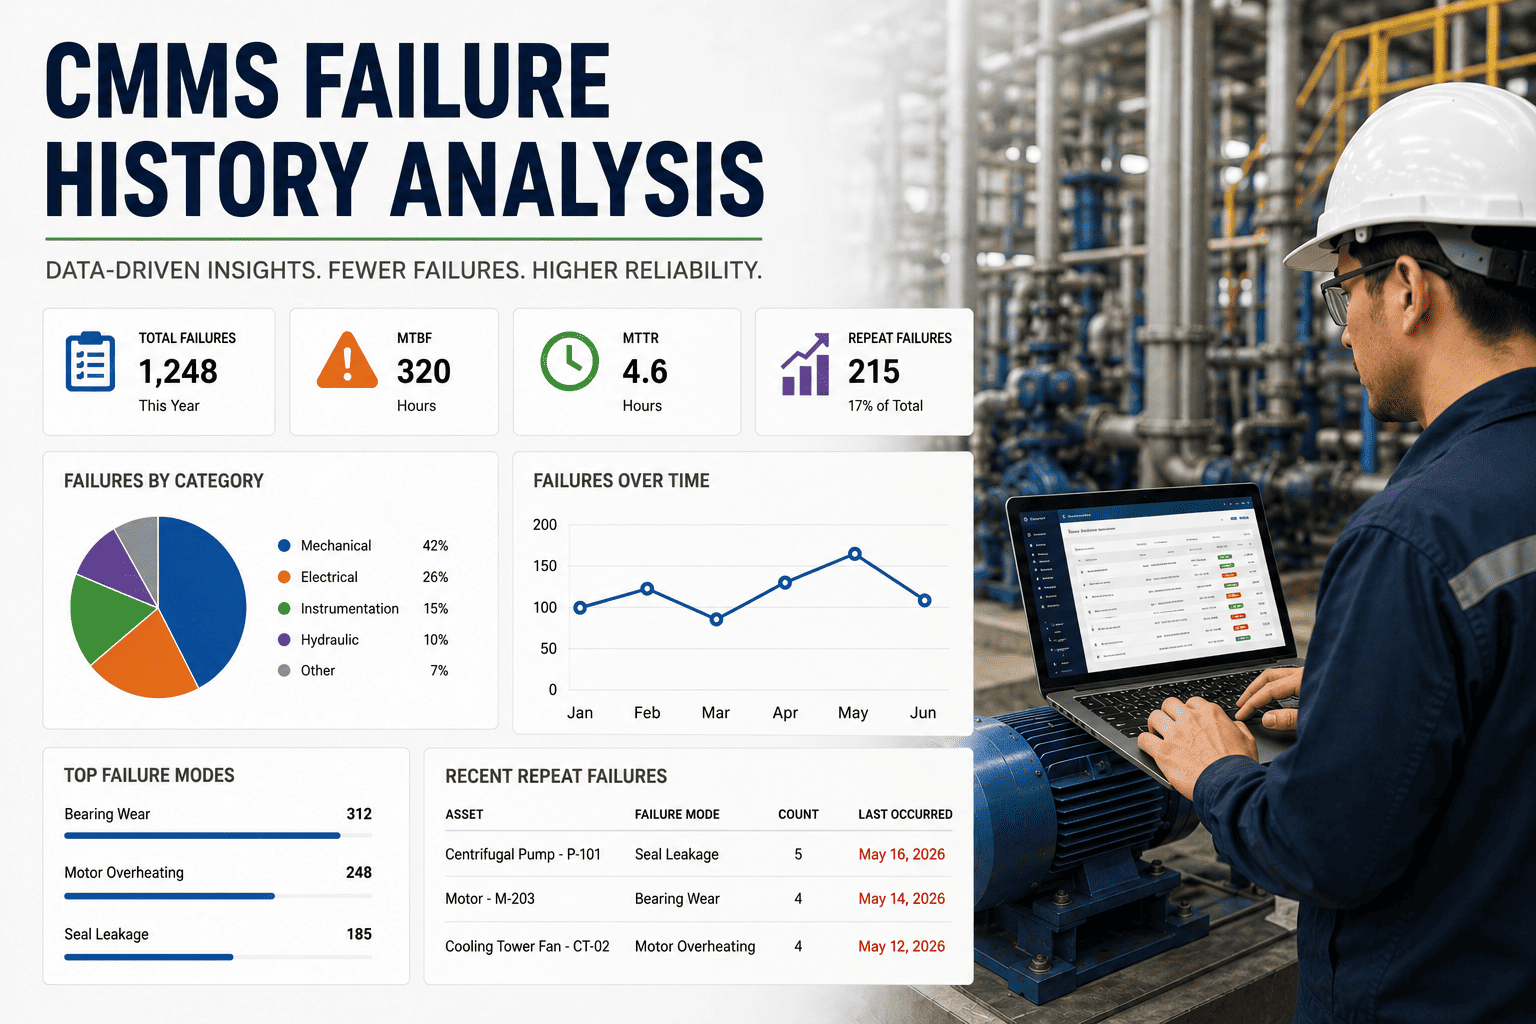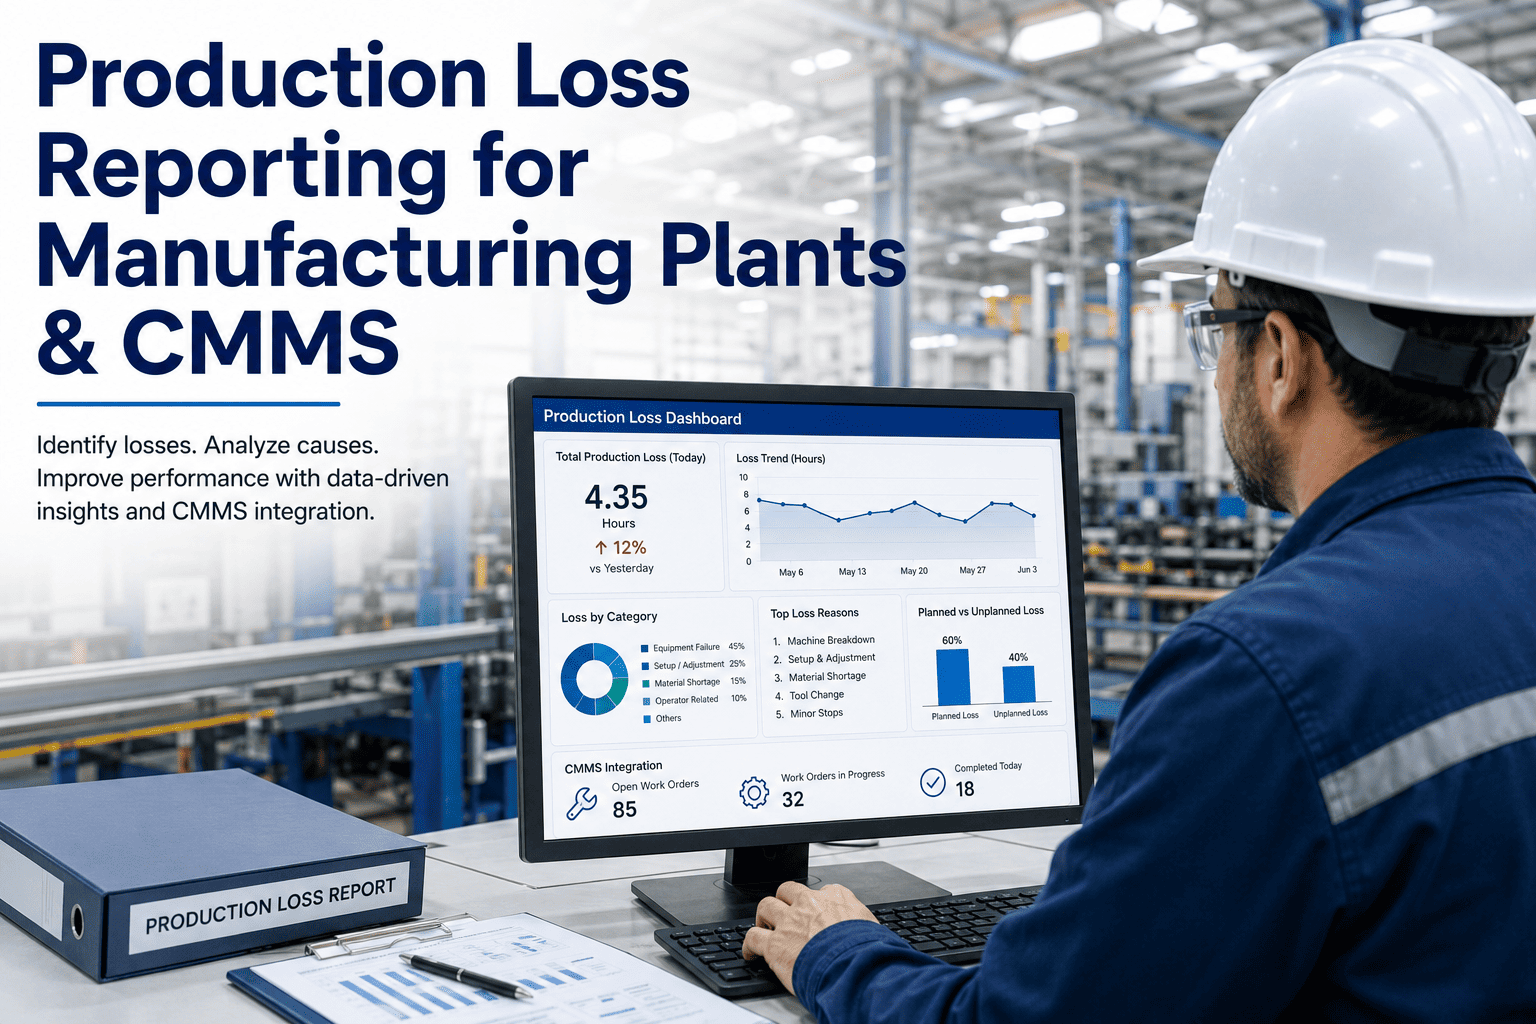
Production equipment performance loss analysis is the systematic process of identifying, measuring, and eliminating the hidden capacity drains that slow down manufacturing assets. While most plants track overall equipment effectiveness (OEE), the majority of CMMS platforms only surface four of the six big losses, leaving critical speed losses and minor stoppage patterns buried in shift logs. A robust CMMS performance analysis bridges this gap by attributing specific downtime events, reject rates, and cycle-time deviations directly to individual assets. By configuring your loss analysis manufacturing metrics correctly, reliability teams can transform raw maintenance data into actionable production projects. See how OxMaint streamlines this data capture when you Start Free Trial today.
CMMS PERFORMANCE ANALYSIS
Is hidden speed loss quietly stealing 15% of your plant's daily capacity?
Most CMMS reports show downtime and availability, but completely miss the micro-stoppages and reduced cycle speeds eating your throughput. OxMaint's production CMMS analytics capture, categorize, and quantify all six big losses so you can recover lost revenue.
EQUIPMENT LOSS ANALYSIS CMMS
The Six Big Losses in Manufacturing Performance Loss
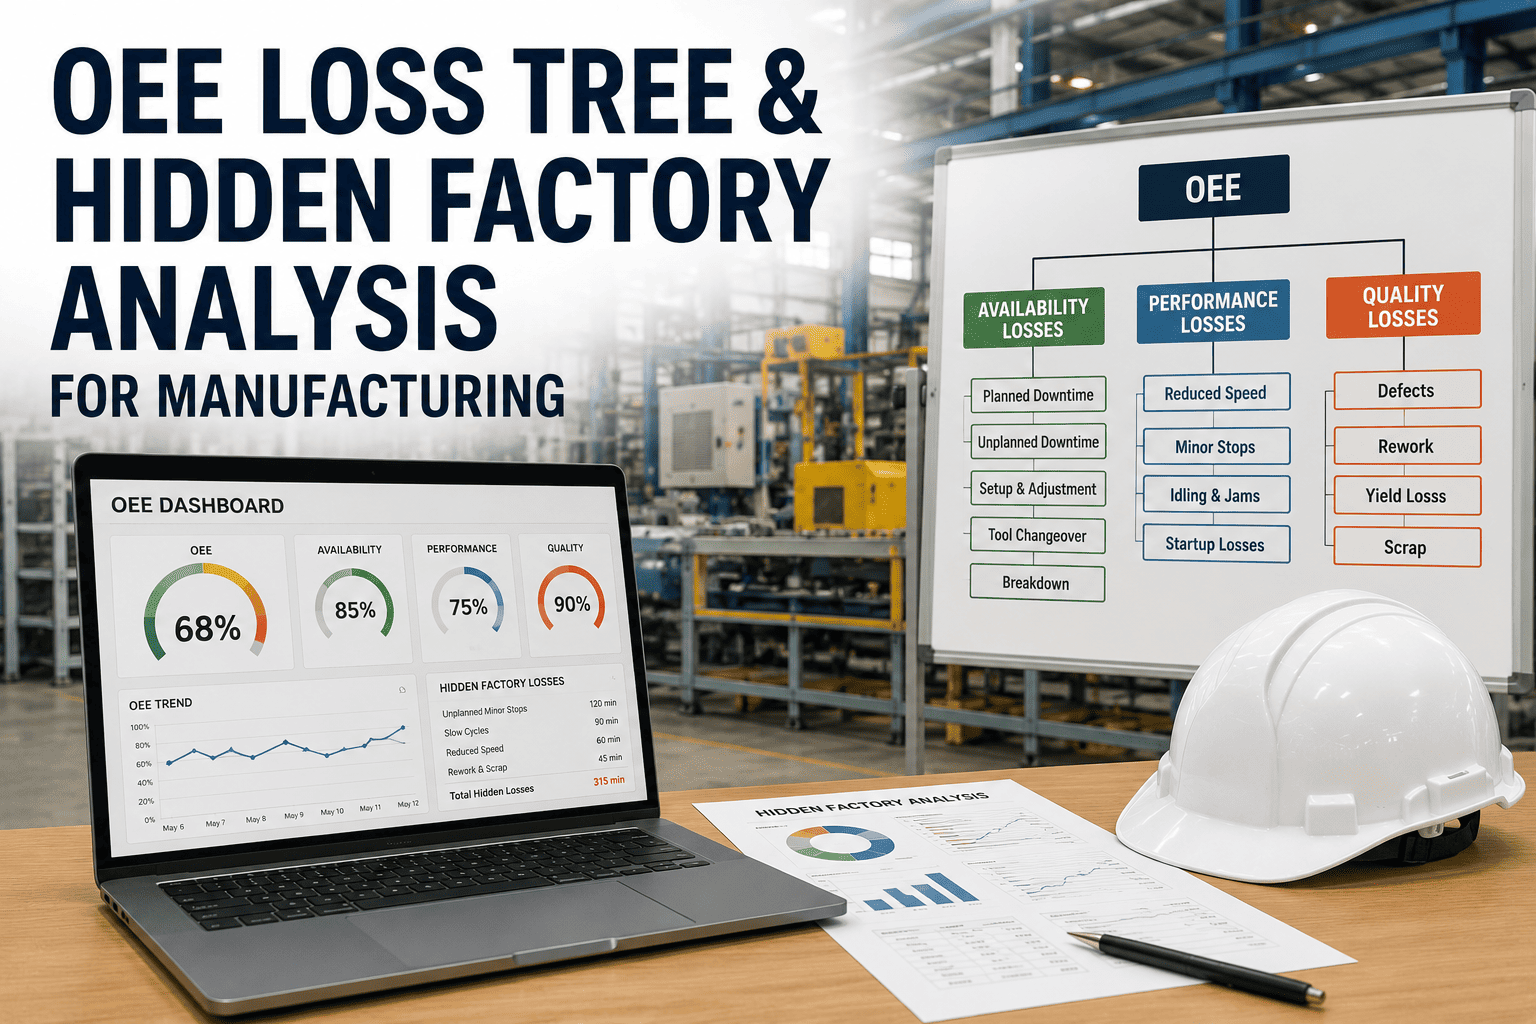
A complete plant performance loss analysis goes beyond basic downtime tracking. Total Productive Maintenance (TPM) defines six distinct categories of waste. To achieve world-class OEE (85%+), your CMMS loss analysis must isolate and track every single one.
Equipment Failure
Availability Loss
Unplanned breakdowns and downtime events that halt production entirely. Tracked via standard CMMS work order completion logs.
Setup & Adjustment
Availability Loss
Time lost during changeovers, tooling swaps, and machine warm-ups. Requires dedicated CMMS status codes for accurate capture.
Idling & Minor Stops
Performance Loss
Brief interruptions (under 5 minutes) like sensor jams or material misfeeds. Rarely logged in paper systems, causing severe blind spots.
Reduced Speed
Performance Loss
When equipment runs below its theoretical maximum cycle time. Often accepted as "normal" without performance loss analysis baseline data.
Process Defects
Quality Loss
Scrap and rejects produced during steady-state production. CMMS must correlate defect spikes to specific maintenance events.
Startup Loss
Quality Loss
Defective units produced while a machine stabilizes after a changeover or cold start. Tracked via production yield integration.
PRODUCTION LOSS CMMS CONFIGURATION
How to Configure CMMS Reporting for Accurate Loss Attribution
Identifying the six losses is only half the battle. To actually perform a meaningful equipment performance loss analysis, your CMMS must be configured with strict attribution rules, standardized downtime codes, and integrated production feeds.
Establish Standardized Downtime Reason Codes
Create a hierarchical taxonomy mapping directly to the six losses. Avoid generic codes like "Mechanical Issue"—force technicians to select "Minor Stop: Material Jam" to ensure your production CMMS analytics generate actionable data.
Integrate Machine Speed and Cycle Counts
Connect PLC and IoT feeds to your CMMS to automatically log ideal cycle time versus actual cycle time. This eliminates manual estimation and exposes hidden reduced-speed losses in real-time.
Enforce Mandatory Shift Handover Logs
Require operators to close out minor stoppage logs before shift change. This captures the thousands of 2-minute micro-stoppages that standard equipment loss analysis CMMS configurations routinely miss.
Link Quality Rejects to Asset History
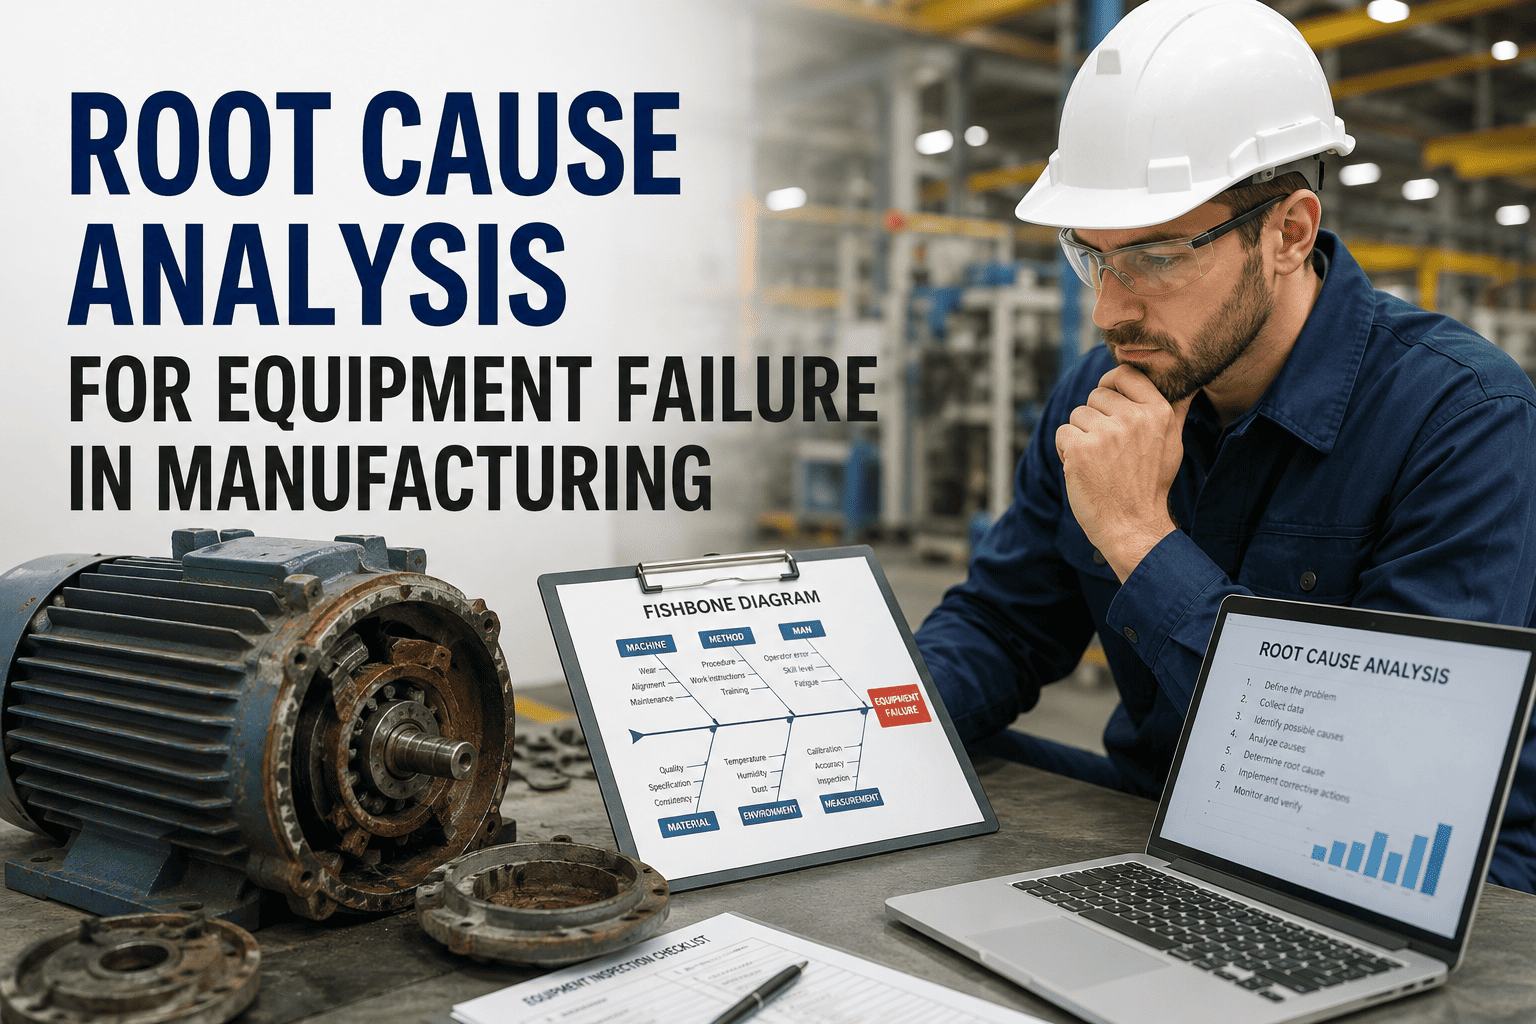
Tag scrap reports with the specific machine ID and active work order. When process defects spike, the CMMS should instantly show recent maintenance interventions or missed PMs on that asset.
REAL-WORLD IMPACT
The Cost of Ignored Performance Losses
Consider a 180-asset automotive parts plant running 3 shifts, generating $12,000 in hourly revenue. Their legacy CMMS tracked availability and basic failures, reporting a healthy 82% OEE. However, a deep loss analysis plant audit revealed their assets were running at 78% of designed cycle speed to prevent wear, and operators were clearing micro-jams 40 times per shift without logging them.
By migrating to OxMaint's production performance CMMS, the plant implemented automated minor-stop tracking and speed-loss dashboards. Within 60 days, maintenance identified a recurring valve issue causing 70% of the micro-jams, and adjusted PM frequencies to recover lost cycle speed. The result was a 9% increase in throughput without purchasing new equipment. Ignoring these hidden losses is never free—you pay for them in lost capacity and missed SLAs.
OXMAINT SOLUTION
How OxMaint Solves Equipment Performance Loss Analysis
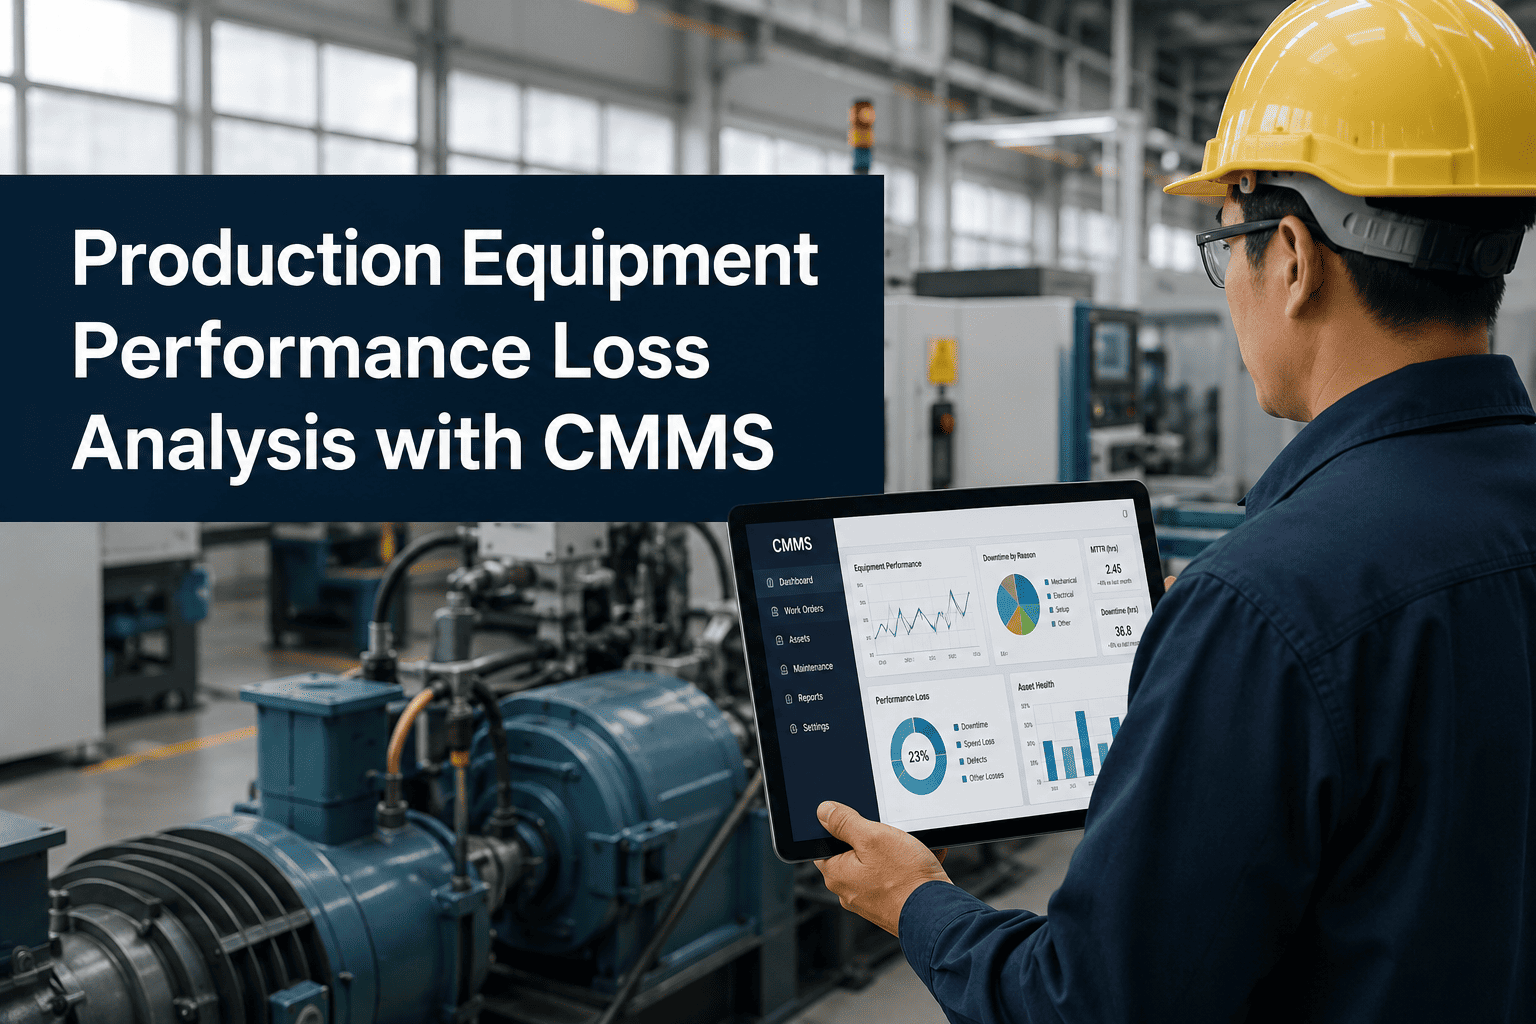
OxMaint is built to bridge the gap between maintenance execution and production performance. Our AI-powered CMMS platform goes beyond work order management to deliver the granular analytics required to eliminate the six big losses.
Automated Speed & Cycle Tracking
OxMaint integrates with your machine sensors to automatically compare ideal versus actual cycle times, instantly flagging reduced-speed operations without manual data entry.
Outcome: Identify speed losses within hours instead of fiscal quarters.
Micro-Stop Pattern Detection
Capture and categorize sub-5-minute stoppages automatically. OxMaint's AI analyzes timestamp data to find the root cause of minor stop patterns that operators usually ignore.
Outcome: Recover up to 5% in daily throughput capacity.
Quality-Maintenance Correlation
Link scrap and reject rates directly to PM compliance and asset health scores. When defect rates rise, OxMaint highlights the specific machine's recent maintenance history.
Outcome: Cut process defect losses by up to 30%.
Automated Loss Review Reports
Generate monthly loss analysis manufacturing reports grouped by asset, shift, and loss category. Say goodbye to manual spreadsheet compilation for your TPM meetings.
Outcome: Save reliability teams 10+ hours per month on reporting.
LOSS ANALYSIS MANUFACTURING WORKFLOW
Monthly Loss Review Timeline: From Data to Real Projects
Data collection is useless without a structured review process. Follow this 4-step monthly timeline to ensure your CMMS loss analysis translates into funded reliability projects and measurable OEE gains.
Automated Data Roll-Up
OxMaint automatically compiles all downtime, speed, and quality data into a unified performance loss dashboard. No manual exports required—data is validated against shift logs and IoT feeds.
Top 3 Loss Identification
The analytics engine highlights the top 3 financial losses across the plant. Reliability engineers review the AI-suggested root causes for unplanned failures, minor stops, and speed deviations.
Cross-Functional Review
Maintenance, operations, and quality teams meet to review the OxMaint loss analysis report. They convert the top losses into targeted improvement projects with defined ROI estimates.
Project & PM Activation
Approved projects are launched. OxMaint automatically updates preventive maintenance schedules, adjusts inspection checklists, and assigns work orders to eliminate the identified loss sources.
Stop guessing where your capacity is leaking.
See exactly how OxMaint exposes hidden micro-stops and speed losses on your plant floor. Book a 30-minute demo with our reliability experts today.
FAQ
Production Equipment Performance Loss Analysis FAQs
What is equipment performance loss analysis in manufacturing?
It is the process of categorizing and quantifying the waste that prevents equipment from reaching its theoretical maximum output. It focuses on the "six big losses"—breakdowns, setup, minor stops, reduced speed, process defects, and startup rejects—to improve overall equipment effectiveness (OEE). You can start tracking these metrics instantly when you Start Free Trial with OxMaint.
How does a CMMS track minor stoppages and speed losses?
Modern CMMS platforms like OxMaint integrate directly with PLCs and machine sensors to log cycle times and operational states. Instead of relying on operator logs, the system automatically records every sub-5-minute stoppage and compares actual run speeds against programmed ideal cycle times.
Why does my CMMS OEE report look good but production output is low?
This usually happens when a CMMS only tracks availability (downtime) and basic quality, but ignores performance losses like reduced speed and micro-stops. If machines are running slower than their nameplate speed or experiencing frequent unlogged brief jams, OEE will appear artificially high while actual throughput lags.
How do you calculate the cost of manufacturing performance loss?
Multiply the total minutes lost in a specific category (e.g., minor stops) by the plant's per-minute production value or margin. For a more precise calculation, factor in the scrap material costs for quality defects and the direct labor costs incurred while the line was running at reduced capacity.
Can OxMaint help transition from reactive maintenance to loss prevention?
Yes. OxMaint uses historical loss data and AI-driven predictive analytics to automatically adjust preventive maintenance schedules. By identifying the root causes of minor stops and speed drops, the platform shifts maintenance from reactive firefighting to proactive loss prevention. Book a demo to see this workflow in action.
Recover your hidden plant capacity with OxMaint
Join the maintenance leaders using OxMaint to eliminate micro-stops, track speed losses, and drive real OEE improvements across their assets.
Free 14-day trial · No credit card