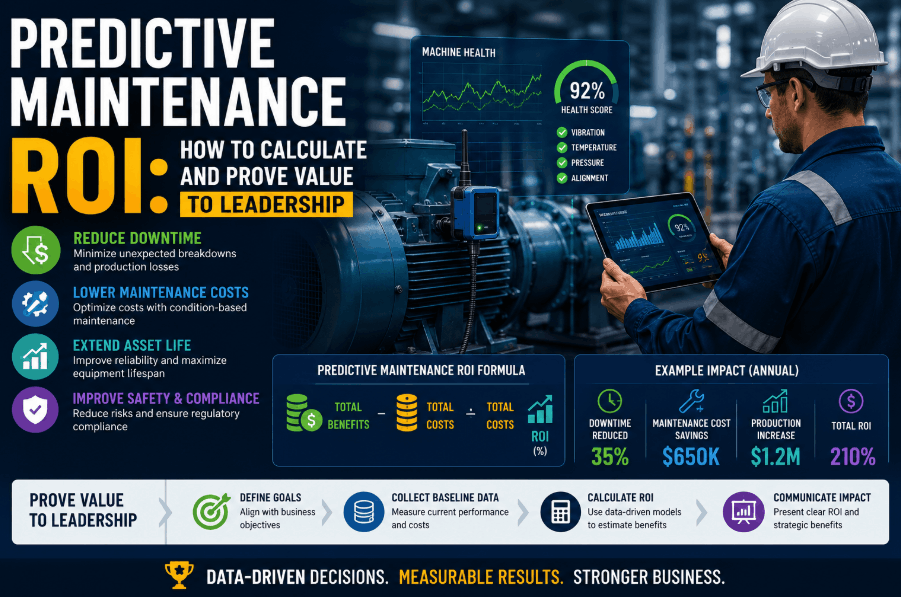
Most maintenance leaders know predictive maintenance works — but knowing it and proving it to a CFO are two different problems. The gap between a functioning PdM program and a funded one is almost always a financial translation problem: engineering teams measure vibration trends and thermal anomalies, while finance teams measure payback periods and net present value. This guide gives maintenance and reliability professionals the exact formulas, benchmarks, and presentation frameworks to calculate predictive maintenance ROI, Sign Up Free and build a business case that wins leadership approval in 2026 — even in capital-constrained environments.
Predictive Maintenance · ROI Tracking · CMMS Analytics
Prove Your PdM Program's Value with Oxmaint
Capture failure avoidance data, track PdM costs by asset, and generate the executive-ready ROI reports that justify continued investment — all in one platform.
Why PdM ROI Is Hard to Prove
The Avoidance Problem: Quantifying Value That Never Showed Up
Predictive maintenance ROI is structurally invisible — its value exists in failures that never happened, downtime hours that never occurred, and parts that were replaced at the right time rather than after catastrophic failure. This makes traditional ROI calculation difficult but not impossible. Book a Demo to see how Oxmaint's work order and asset history module creates the longitudinal data trail that turns avoided failure into documented financial value.
8–12×
Documented ROI range for mature PdM programs vs baseline maintenance spend
25–30%
Average reduction in maintenance costs after PdM implementation
70–75%
Elimination rate of unexpected equipment breakdowns in high-maturity programs
9–18 mo
Typical payback period for PdM investment across discrete manufacturing
Core ROI Formulas
The 5 Formulas That Translate PdM Value Into Financial Language
Each formula below maps a specific maintenance outcome to a financial metric that finance teams and plant leadership recognize. Use these in combination to build a complete ROI picture — no single formula alone captures the full value of a functioning predictive maintenance program. Sign Up Free and use Oxmaint to populate these formulas from real work order and asset failure data.
Failure Avoidance Value
Failures Prevented × (Avg Repair Cost + Avg Downtime Hours × Hourly Production Value)
The most direct ROI argument. If your PdM program detected 8 bearing failures before catastrophic collapse — each averaging $14,000 in emergency repair cost and 6 hours of downtime at $95,000/hr — the avoided cost is $4.68M against a sensor and labor investment that is a fraction of that figure.
Planned vs Emergency Repair Differential
Emergency Repair Cost − PdM-Triggered Planned Repair Cost × Intervention Count
PdM converts emergency repairs into scheduled interventions. Emergency motor replacement averages $22,000–$38,000 including expedited parts, overtime labor, and production loss. A PdM-triggered replacement of the same motor runs $6,000–$9,000. At 30 interventions per year, that differential is worth $480,000–$870,000 annually.
Parts and Inventory Optimization Savings
Prior Spare Parts Spend − Post-PdM Spare Parts Spend + Stockout Cost Reduction
PdM programs reduce both over-stocking and emergency procurement. Plants moving from reactive to condition-based replacement typically reduce spare parts inventory value by 15–25% while simultaneously eliminating the premium costs of emergency orders — which carry 40–80% price premiums over planned procurement.
OEE Improvement Revenue Value
OEE Gain % × Nameplate Capacity × Margin per Unit of Output
Every percentage point of OEE improvement is a revenue multiplier. Moving from 71% to 78% OEE on a line with $18,000/hr margin-bearing output capacity generates $1.26M annually in recovered production value — achieved entirely through reliability improvement, with zero new capital equipment.
Extended Asset Life Value
Asset Replacement Cost × (Extended Life Years ÷ Original Design Life)
A $2.4M press with a 20-year design life extended to 27 years through PdM-based intervention avoids $840,000 in capital replacement — a direct CapEx avoidance figure that finance teams understand immediately. This argument is especially powerful for assets approaching end-of-life where replacement budgets are being discussed.
Total Cost of Ownership Reduction
(Pre-PdM Annual Maintenance Cost − Post-PdM Annual Maintenance Cost) × Asset Portfolio Size
At the program level, PdM's TCO argument is compelling: documented industry averages show 25–30% total maintenance cost reduction across the monitored asset base. On a $3.2M annual maintenance budget, that is $800,000–$960,000 in sustainable, recurring savings — not a one-time gain.
Business Case Framework
Building the PdM Business Case: A Structure That Gets Approved
A predictive maintenance ROI presentation that wins approval is not a technical document — it is a financial narrative that begins with risk and ends with return. Book a Demo and see how Oxmaint's reporting module auto-generates the cost and performance data that anchors every section of this framework.
Section 01
Baseline: Current State Cost and Risk Exposure
Open with your current reactive maintenance ratio, total unplanned downtime hours in the prior 12 months, emergency repair spend, and two or three major failure events with documented production loss. This is not a criticism of past performance — it is a baseline that makes the ROI of change legible to non-technical leadership.
Section 02
PdM Investment: Total Cost of Implementation
Present the full investment clearly: sensor hardware (vibration, thermal, ultrasound), CMMS integration and configuration, technician training, and ongoing subscription costs. Transparency here builds credibility. Break costs into Year 1 (highest) and recurring annual (significantly lower) to show the improving ROI trajectory over time.
Section 03
Projected Returns: Apply the 5 ROI Formulas
Apply the failure avoidance, repair differential, OEE, parts optimization, and asset life formulas to your specific asset base. Use conservative assumptions — underpromising on projections builds credibility with skeptical finance teams. A conservative case that performs is better than an aggressive case that misses.
Section 04
Payback Timeline and NPV
Convert your ROI projections into a payback period and 5-year NPV. Most manufacturing PdM programs break even between months 9 and 18. After breakeven, the recurring cost avoidance compounds. A $280,000 Year 1 investment with $420,000 in documented savings becomes a 5-year NPV of $1.4M–$1.8M at conservative discount rates.
Industry Benchmarks
2026 PdM ROI Benchmarks by Industry and Asset Type
Grounding your business case in industry benchmarks removes the perception that your projections are self-serving estimates. Present these reference points alongside your facility-specific calculations to show leadership that your projections are conservative relative to documented industry outcomes. Sign Up Free to connect your Oxmaint asset data to these benchmarks for a credible comparison.
| Industry / Asset Type |
Typical PdM ROI |
Payback Period |
Primary Value Driver |
Key PdM Technology |
| Discrete Manufacturing — Rotating Equipment |
8–12× |
9–15 months |
Bearing and shaft failure avoidance |
Vibration analysis, CMMS integration |
| Process / Chemical — Critical Pumps |
10–15× |
6–12 months |
Seal failure prevention, unplanned shutdown avoidance |
Ultrasound, thermal imaging, vibration |
| Food and Beverage — Packaging Lines |
6–9× |
12–18 months |
Line uptime, changeover efficiency, compliance |
Vibration, motor current analysis |
| Utilities / Energy — Electrical Switchgear |
12–20× |
6–10 months |
Catastrophic failure prevention, safety incident avoidance |
Thermal imaging, partial discharge monitoring |
| Heavy Industry — Compressors and Turbines |
15–25× |
8–14 months |
Catastrophic failure avoidance, parts life optimization |
Oil analysis, vibration, thermography |
Common Calculation Errors
5 PdM ROI Calculation Mistakes That Undermine Your Business Case
An ROI case built on flawed methodology damages credibility and rarely survives scrutiny from a financially literate leadership team. Avoid these common errors to ensure your predictive maintenance business case holds up under questioning. Book a Demo to see how Oxmaint's data infrastructure prevents these errors by grounding every calculation in verified work order and asset history data.
Error 01
Attributing All Downtime Reduction to PdM
Downtime improvements often come from multiple concurrent initiatives. Attribute only the portion demonstrably linked to PdM interventions — use control groups or pre/post asset-level comparisons from CMMS data to isolate PdM's specific contribution.
Fix: Asset-Level Attribution in CMMS
Error 02
Using Best-Case Rather Than Median Failure Cost
Projecting ROI using your most expensive failure events inflates the business case. Use median failure cost across asset type — finance teams will check and will discount any case that appears to cherry-pick data. Conservative numbers that survive scrutiny are worth more than aggressive numbers that don't.
Fix: Median Cost from Work Order History
Error 03
Excluding Implementation and Ongoing Costs
Training time, integration labor, false alarm investigation, and technician route time are real PdM costs that must appear in the denominator. Omitting them produces ROI numbers that look suspicious and collapse under due diligence.
Fix: Full Cost Accounting by Category
Error 04
Projecting Year 1 ROI as Representative
PdM programs typically underperform in Year 1 as baselines are established and technicians build diagnostic competency. Present a 3-year or 5-year model that shows the improving ROI trajectory — finance teams understand that infrastructure investments have ramp periods.
Fix: Multi-Year NPV Model
Error 05
Measuring Only Cost Avoidance, Not Capacity Value
Many PdM business cases stop at repair cost savings and miss the larger OEE improvement revenue argument. If reliability improvement allows production to capture demand that was previously constrained by downtime, that revenue value often exceeds the repair cost savings by 3–5×.
Fix: Include OEE Revenue Impact Formula
Error 06
No Tracking Mechanism for Ongoing ROI Validation
Leadership approval is not a one-time event — ongoing PdM investment must be re-justified annually. Without a CMMS-based tracking system that continuously documents interventions, avoided failures, and cost outcomes, year 2 budget conversations start from scratch instead of building on proven performance.
Fix: Continuous ROI Tracking in CMMS
PdM ROI · Work Order Data · Executive Reporting
Track Every PdM Intervention and Its Financial Outcome
Oxmaint links work orders to assets, failure events to cost data, and interventions to avoided downtime — giving you the continuous ROI documentation that justifies PdM investment year after year.
Common Questions
Predictive Maintenance ROI — Questions from Maintenance Leaders and Finance Teams
What is a realistic ROI for a predictive maintenance program in manufacturing?
Industry-documented ROI for mature PdM programs ranges from 8× to 12× in discrete manufacturing, and up to 20× in utilities and heavy industry. Most programs reach payback between 9 and 18 months, with ROI compounding as technician diagnostic competency matures.
How do I calculate the value of a failure my PdM program prevented?
Use: Avoided Repair Cost + (Avoided Downtime Hours × Hourly Production Value). Pull average repair cost and downtime duration from historical work orders for similar failure events. Oxmaint's asset history module surfaces this data automatically by asset class.
What data do I need before building a PdM ROI business case?
At minimum: 12 months of failure history by asset, average repair cost by failure type, hourly production value, current reactive vs planned ratio, and spare parts spend. A CMMS like Oxmaint generates all of this from existing work order records.
Should PdM sensors and hardware be capitalized or expensed?
Permanent condition monitoring hardware (vibration sensors, ultrasound transducers installed as fixed infrastructure) is typically capitalizable as a plant improvement under GAAP/IFRS. Software subscriptions and portable monitoring tools are generally OPEX. Consult your controller for asset-specific classification.
How does a CMMS support predictive maintenance ROI tracking?
A CMMS like Oxmaint links PdM-triggered work orders to specific assets, records intervention costs, and tracks subsequent failure history — creating the longitudinal data trail that proves avoided failure value over time. Without CMMS tracking, PdM ROI claims remain anecdotal and hard to defend in budget reviews.
How long before a predictive maintenance program shows measurable ROI?
Most programs show early indicators (reduced emergency callouts, intervention cost differential) within 3–6 months. Full ROI documentation, including avoided failure patterns across asset classes, typically emerges clearly in months 9–18 as enough intervention history accumulates for statistically meaningful comparison.
Predictive Maintenance · Asset Intelligence · ROI Documentation
Build a PdM Business Case Leadership Will Approve
Oxmaint gives you the asset history, intervention tracking, and executive reporting tools to calculate, document, and present predictive maintenance ROI with confidence — every budget cycle.