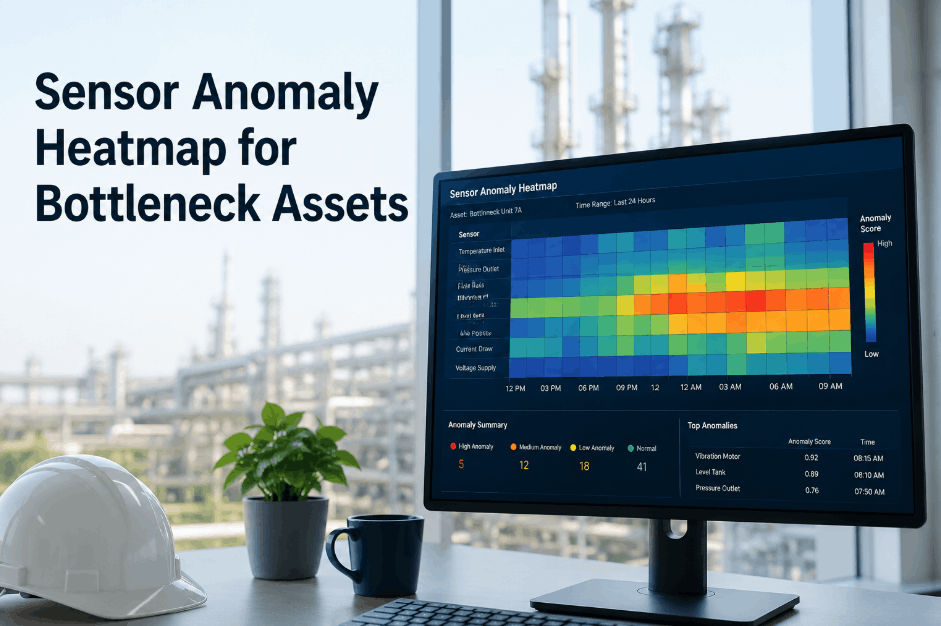
Industrial plants running at capacity cannot afford to misread sensor data on bottleneck assets. When telemetry from critical equipment drifts without detection, maintenance teams lose the early warning window that separates a planned repair from an unplanned shutdown. Sensor anomaly heatmaps give operations teams a visual layer on top of raw signal data — so calibration shifts, measurement instability, and pattern deviations are caught before they corrupt process decisions. Sign Up Free to connect OxMaint's asset monitoring tools to your instrumentation data and start visualizing signal variance across your most critical equipment today.
Turn Sensor Noise Into Actionable Maintenance Intelligence
OxMaint gives plant and reliability teams asset observability tools, condition-based work order triggers, anomaly logging, and predictive diagnostics — built for industrial operations that need signal confidence on every bottleneck asset.
Why Bottleneck Assets Demand a Separate Anomaly Detection Standard
Not every asset on the plant floor carries the same production risk. Bottleneck assets — equipment whose failure stalls output across the entire line — require a higher standard of signal monitoring than general machinery. When a sensor on a bottleneck asset drifts into false stability or produces intermittent noise, operations teams relying on raw readings make incorrect process adjustments. Book a Demo to see how OxMaint's asset criticality tagging separates bottleneck instrumentation from general monitoring pools — so anomaly thresholds, alert rules, and work order triggers are calibrated to the actual operational consequence of each measurement point. Applying plant-wide average tolerances to critical assets is one of the most common causes of late fault detection in high-throughput manufacturing environments.
Signal Deviation Categories Every Reliability Team Should Classify
Calibration Shift
Gradual offset from baseline reading that appears stable but deviates from actual process values. Often missed in routine reviews because readings remain within range. Requires trend comparison against historical baseline to detect. OxMaint logs baseline readings per asset for drift comparison.
Intermittent Spike
Short-duration exceedances that reset quickly and evade threshold-based alerts. Indicates mechanical looseness, connection degradation, or early bearing wear. Heatmap visualization surfaces spike frequency even when individual events fall below alert thresholds. Book a Demo to see OxMaint's event frequency logging.
Measurement Flatline
Sensor reporting a constant value despite changing process conditions — a signal integrity failure often confused with stable operation. Flatline detection requires comparison against correlated sensors on the same asset or process loop. OxMaint cross-references related measurement points to flag frozen readings.
Pattern Deviation
Normal range readings that no longer follow expected cyclical or load-dependent patterns. Indicates degrading asset behavior that standard min/max alerts will not capture. Pattern deviation detection is only possible with baseline trend models — which OxMaint builds per asset from historical inspection and telemetry data. Sign Up Free to start building baselines.
Sensor Anomaly Response Standards by Asset Criticality
| Anomaly Type | Asset Criticality | Detection Method | Response Window | OxMaint Action |
|---|---|---|---|---|
| Calibration Shift | Bottleneck / Critical | Baseline trend comparison | Same shift | Auto work order + alert |
| Intermittent Spike | Essential | Frequency heatmap | Within 4 hours | Flagged inspection task |
| Measurement Flatline | Any with active control loop | Cross-sensor correlation | Immediate | Critical alert + escalation |
| Pattern Deviation | Standard / Non-critical | Historical pattern model | 24–48 hours | Scheduled diagnostic task |
Building a Sensor Anomaly Program with OxMaint: Phase by Phase
Asset and Instrumentation Inventory
Tag every instrumented asset in OxMaint with criticality tier, process dependency, and sensor point list. Instrumentation without an asset context cannot be prioritized for anomaly review. Sign Up Free to start your asset registry today.
Baseline Capture and Threshold Definition
Establish normal operating ranges and expected signal patterns per asset under defined load conditions. OxMaint stores measurement baselines against asset records — so drift and deviation comparisons are anchored to actual operational history, not generic specs.
Anomaly Detection Rules and Work Order Triggers
Configure condition-based work order creation rules in OxMaint that fire when telemetry crosses deviation thresholds or frequency heatmaps exceed defined event density. Automated triggers remove dispatcher judgment from anomaly response on critical assets.
Heatmap Review and Reliability Reporting
Use OxMaint's maintenance analytics to review anomaly frequency by asset, shift, and zone over rolling periods. Pattern recognition across heatmap history supports predictive diagnostic decisions — and builds the data trail needed for reliability reporting and capital planning. Book a Demo to see the analytics dashboard.
Reactive Signal Monitoring vs. Heatmap-Driven Anomaly Detection
Stop Guessing Which Sensor Readings to Trust
OxMaint gives reliability and operations teams asset-linked telemetry logging, condition-based work order automation, anomaly frequency tracking, and maintenance analytics — purpose-built for plant teams that need data confidence on every bottleneck asset.
Frequently Asked Questions: Sensor Anomaly Heatmaps for Bottleneck Assets
What is a sensor anomaly heatmap in industrial maintenance?
A sensor anomaly heatmap visualizes the frequency and intensity of signal deviations across assets over time — so reliability teams can identify which equipment produces the most unstable readings and prioritize diagnostic action accordingly.
How does OxMaint help detect calibration drift on critical assets?
OxMaint stores measurement baselines per asset and flags deviations from historical operating ranges during inspection rounds or condition monitoring checks, triggering work orders before drift corrupts process control decisions.
What is the difference between a signal spike and a pattern deviation?
A spike is a short-duration exceedance that resets quickly. A pattern deviation is a sustained change in how readings behave relative to load or cycle — often within normal range but no longer following expected correlation patterns.
Can a CMMS support condition-based maintenance without a dedicated IoT platform?
Yes — OxMaint supports manual condition logging, inspection-triggered work orders, and technician-recorded readings that feed the same anomaly detection and baseline comparison logic used for automated telemetry inputs.
Why should bottleneck assets have separate anomaly thresholds?
Because their failure consequence is disproportionate to their share of the asset fleet. A deviation that is acceptable on a redundant secondary unit becomes a production-stopping event on a bottleneck — different thresholds reflect different operational risk.
Ready to Build Signal Confidence Across Your Critical Assets?
OxMaint gives plant maintenance teams asset criticality tagging, condition-based work order automation, anomaly logging, and predictive diagnostics — so every sensor reading on a bottleneck asset is tracked, trended, and acted on before it becomes a production event.