The conveyor drive stops at 6 a.m. again. Maintenance swaps the bearing, the line restarts, everyone moves on. Three weeks later, the same drive stops for the same reason. Sound familiar? Recurring failures are the most expensive kind because the factory has already paid to learn the lesson and then skipped it. This guide shows how to find your repeat offenders, dig out the real root cause, and make sure the fix sticks, using OXMAINT AI, the AI-native CMMS that keeps every failure, cause and fix in one searchable history.
Factory Maintenance · Reliability · Root Cause Analysis
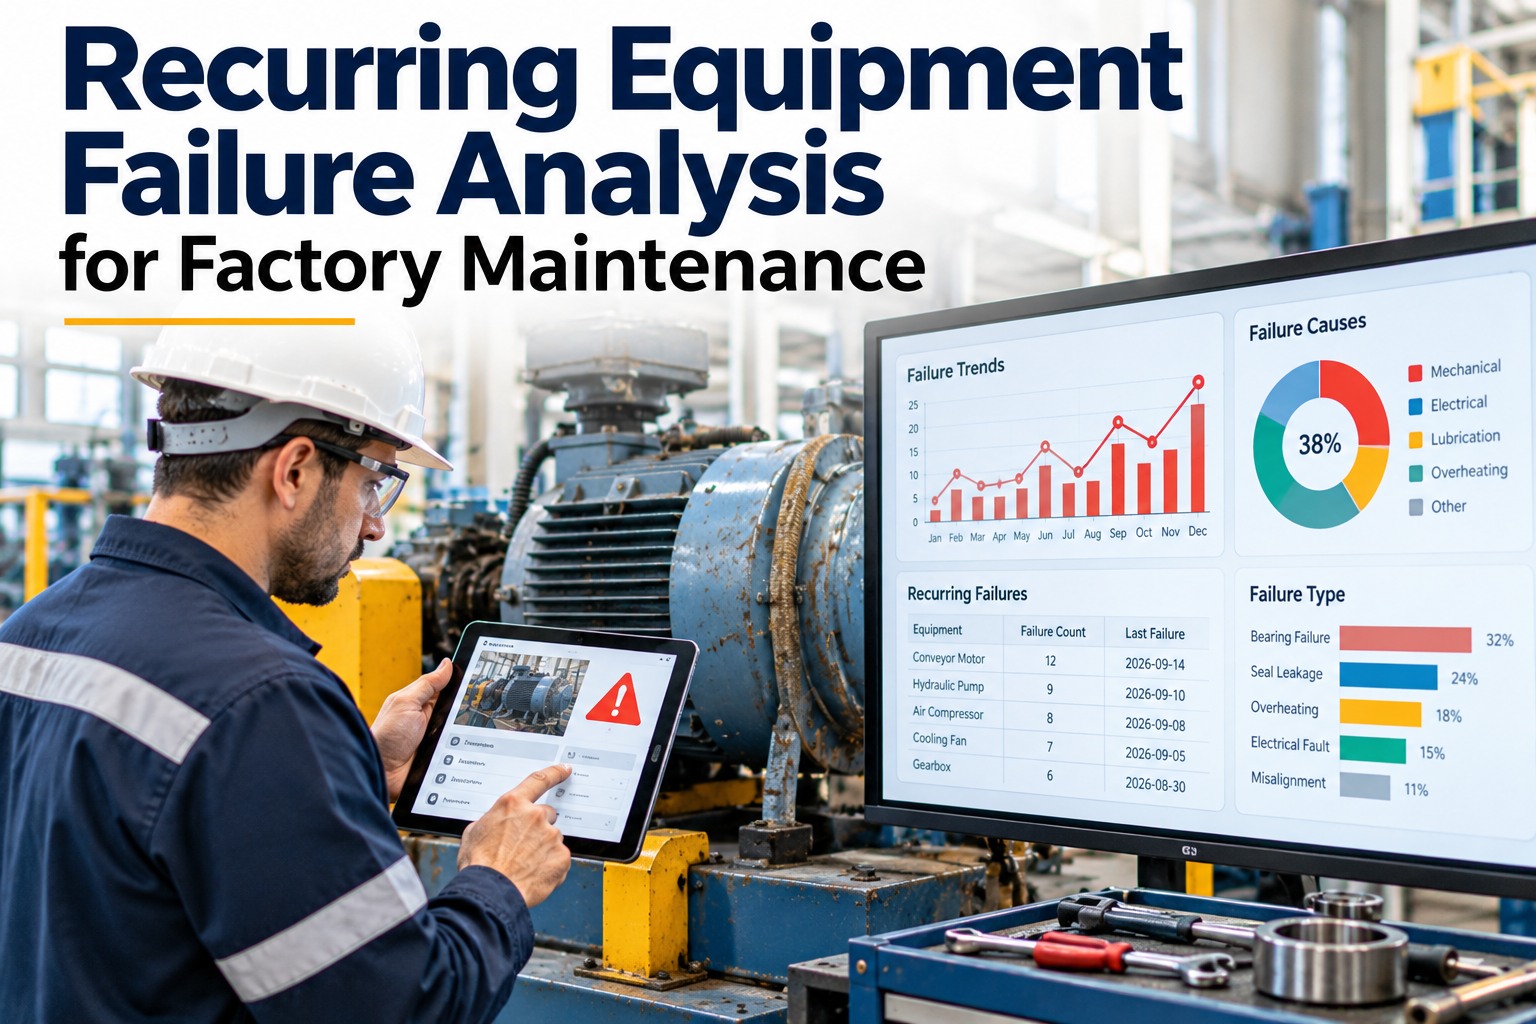
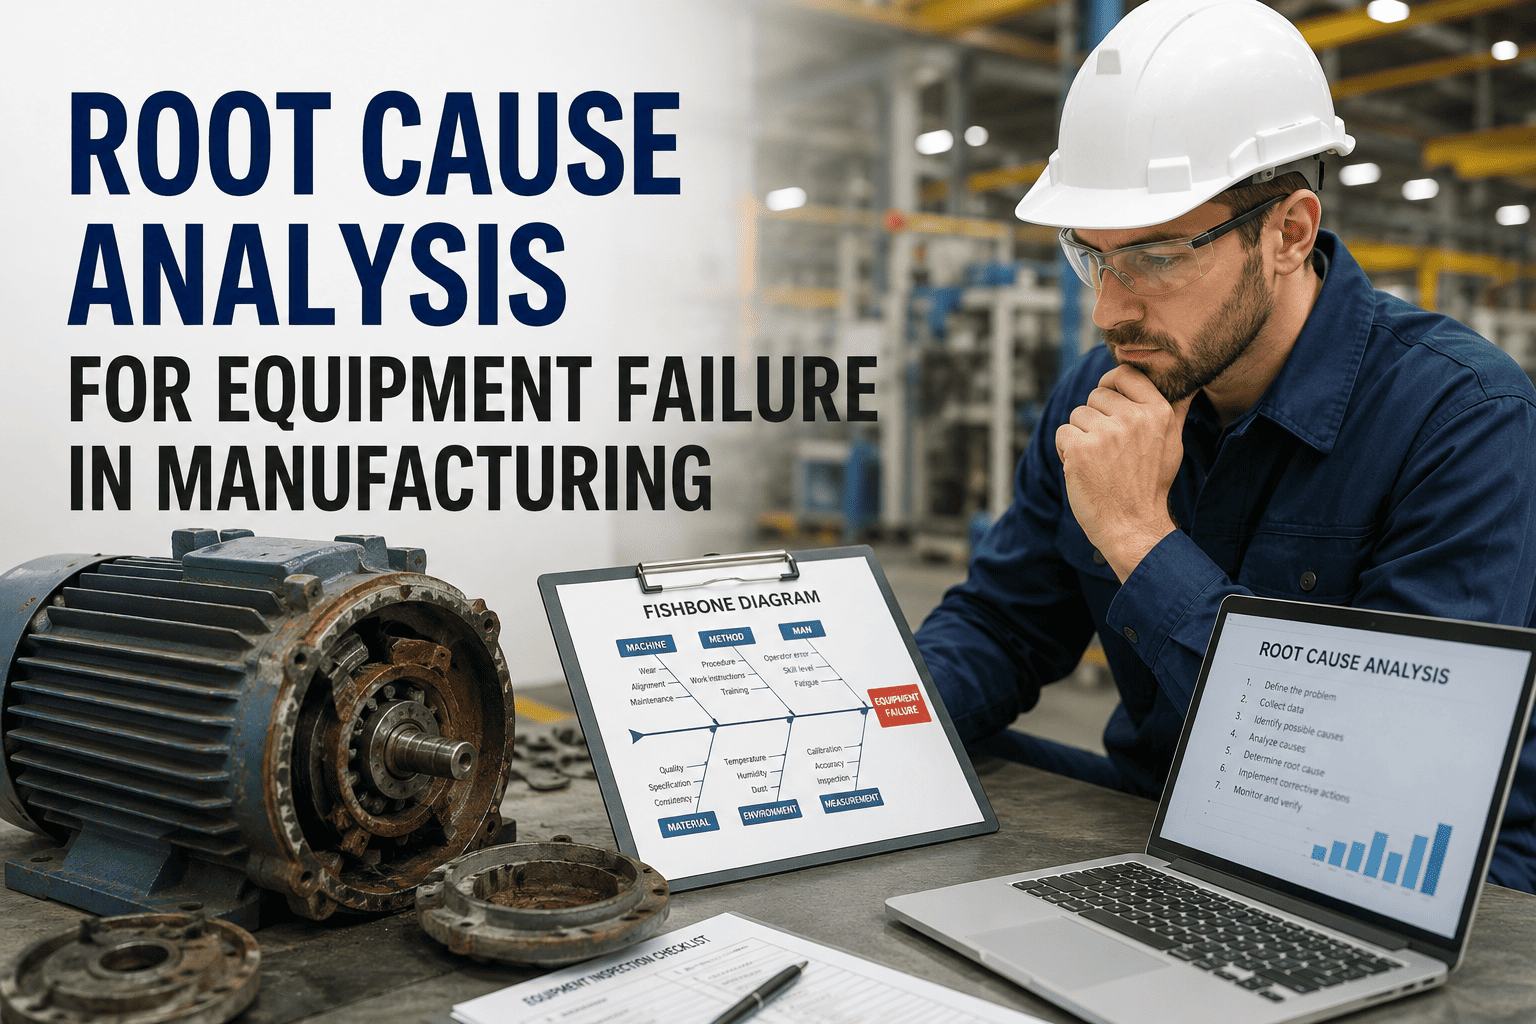
Recurring Equipment Failure Analysis for Factory Maintenance
OXMAINT AI, the AI-native CMMS and maintenance management software, records every breakdown against the asset, surfaces repeat failures, and turns root-cause findings into updated PMs and tracked corrective work orders.
Full Asset History
Repeat Failure Tracking
Closed-Loop Corrective Actions
Few Assets
usually cause most of the downtime on a plant floor
3 Codes
problem, cause and remedy turn notes into data
4 Methods
5 Whys, fishbone, FMEA, fault tree
1 Loop
capture, analyze, fix, verify, repeat
The Repeat Failure Loop
Most plants do not have a repair problem. They have a learning problem. The loop below runs quietly in many factories because the fix is recorded as "replaced part" and the cause is never written down. Break it at the third box. Sign up free and start capturing causes on every work order.
1
Machine Fails
Line stops, pressure builds
→
2
Quick Fix
Swap the part, restart
→
3
Cause Not Recorded
The lesson is lost
→
4
Same Failure Returns
Weeks or months later
Find Your Bad Actors with a Pareto View
A Pareto chart ranks assets by downtime, cost or failure count. It shows where a small amount of engineering effort pays back the most. Teams with clean maintenance history can build this in minutes. Teams without it spend weeks in spreadsheets. Book a demo to see failure reports by asset.
Illustrative Downtime Share by Asset
Bars = share of downtime · numbers above = cumulative total · amber bars are the bad actors to analyze first
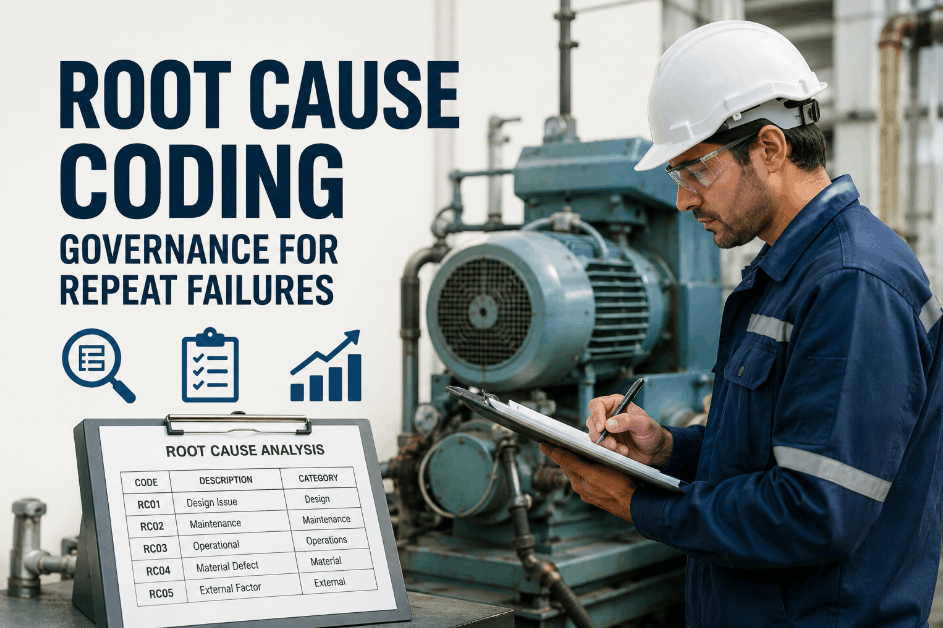
Turn Notes into Data: The Problem, Cause, Remedy Habit
"Fixed" and "replaced part" tell you nothing a year later. Three short fields at work order close-out make failures countable, comparable and searchable. Keep the picklists short so technicians actually use them.
PROBLEM
What happened?
Bearing seized
CAUSE
Why did it happen?
Lubrication missed
REMEDY
What fixed it?
Replaced and re-greased
Dig Deeper: A 5 Whys Example
The simplest root cause method is also one of the most effective. Keep asking why until you reach something the plant can change: a process, a plan or a standard, not just a broken part.
ProblemConveyor drive stopped
Why 1The motor overheated and tripped
Why 2The gearbox bearing was running hot
Why 3The gearbox was low on lubricant
Why 4The lubrication PM was overdue
Root CausePM schedule was not updated after the line speed was increased
Real fix: update the PM frequency, add PM review to the change checklist, and verify no repeat in the next 90 days. Replacing the bearing alone would have guaranteed another failure.
Which Analysis Method Fits the Problem?
5 Whys
USE WHEN
One clear failure and a likely single chain of causes. Fast and cheap.
Fishbone Diagram
USE WHEN
Many possible causes across people, method, machine, material and environment.
FMEA
USE WHEN
You want to rank risks and prevent failures before they happen on critical equipment.
Fault Tree
USE WHEN
A serious or complex event needs multiple combined causes mapped out.
Your Maintenance History Already Knows Which Failures Keep Coming Back.
OXMAINT AI keeps every work order, part, cost and note against the asset, so repeat failures are visible in seconds instead of buried in notebooks and spreadsheets.
The 6-Step Closed-Loop Workflow
1
Capture
Every failure logged as a work order with photos, time and cause.
2
Flag Repeats
Define repeat (same asset, same failure, within your window) and review weekly.
3
Rank
Sort by downtime and cost to pick the top bad actors.
4
Analyze
Run the right RCA method with operators and technicians together.
5
Fix & Update
Raise corrective work orders and update the PM, spares and procedure.
6
Verify
Track the asset after the fix and confirm the failure does not return.
KPIs That Prove the Loop Is Working
▲
MTBF
Mean time between failures. Should rise.
▼
MTTR
Mean time to repair. Should fall.
▼
Repeat Failure Rate
Share of failures that return in your window.
▼
Reactive Work %
Breakdown work as a share of all maintenance.
▲
Corrective Actions Closed
RCA actions finished on time.
What OXMAINT AI Gives Your Reliability Team
Labour, parts, photos and status for every job, linked to the asset.
Maintenance history, health scoring and warranties in one place per machine.
QR Fault Reporting
Operators scan a machine's QR tag and report a problem in seconds, with a photo.
Change a PM schedule or checklist when the analysis shows the plan was wrong.
Summaries that highlight open issues and spot recurring alerts across shifts.
Trend dashboards plus plain-English questions like which assets need attention.
4 Habits That Keep the Same Failure Coming Back
✕Closing work orders with "fixed" and nothing else
✕Replacing parts without asking why they failed
✕Running RCA only after big breakdowns, never on small repeats
✕Finding the root cause but never updating the PM or procedure
"
Illustrative scenario: a plant keeps replacing the same gearbox bearing. When the team reviews history by asset, they see five similar jobs in a year, trace them to a missed lubrication task, and fix the PM. The next review shows no repeat.
Example use case · Factory maintenance team
Frequently Asked Questions
What counts as a recurring equipment failure?
The same asset failing in the same way within a time window you define, such as 30 or 90 days. Pick a rule that fits your equipment and apply it consistently so your repeat failure rate means something.
Sign up free and start tracking by asset.
How does a CMMS help with root cause analysis?
A CMMS gives you the evidence: dates, causes, parts, costs, photos and technician notes per asset. It also turns findings into corrective work orders and PM changes you can track to completion.
Book a demo to see asset history in action.
Do we need failure codes?
They help a lot. Even a short list of problem, cause and remedy options makes failures countable and comparable. Start small, review the list every quarter, and avoid long menus nobody uses.
Book a demo to plan your close-out setup.
Can predictive maintenance reduce repeat failures?
Where sensor or PLC data is available, OXMAINT AI can monitor asset condition and raise proactive work orders before a known failure mode returns. It works best when paired with a proper root cause fix.
Start free and explore predictive options.
Stop Paying for the Same Breakdown Twice.
Capture every failure, find the root cause, update the plan and verify the result, all in OXMAINT AI, the mobile-first CMMS built for factory reliability.