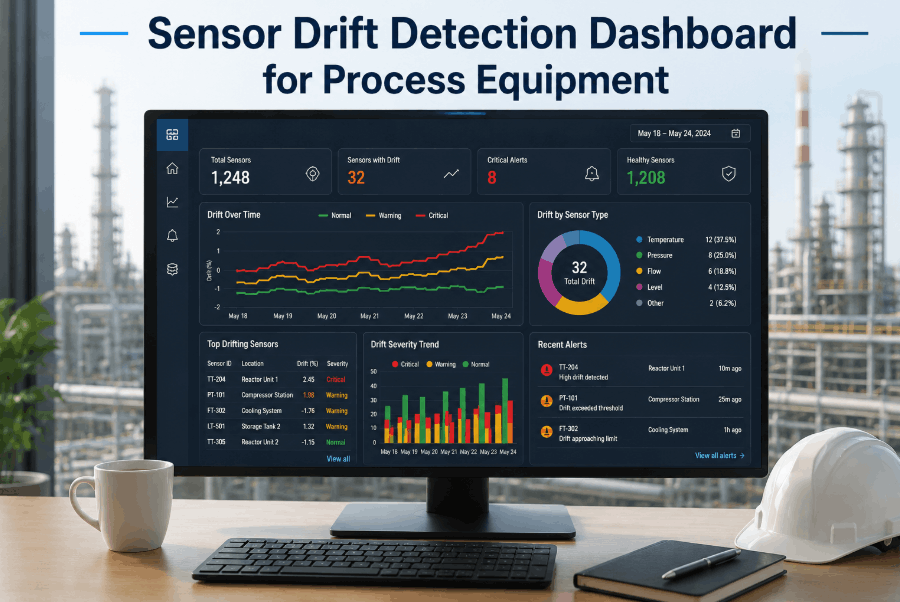
Process equipment in manufacturing and industrial facilities loses measurement accuracy silently—sensor drift corrupts readings before operators realize decisions are being made on faulty data. Unchecked drift leads to process deviations, quality failures, and unplanned shutdowns that cost far more than early detection would have. Sign Up Free with Oxmaint to connect your sensor telemetry, centralize equipment health monitoring, and stop drift-driven losses before they compound. This guide walks plant managers, reliability engineers, and control room teams through a structured approach to building a sensor drift detection dashboard that keeps process decisions anchored to clean, verified data.
How Sensor Drift Degrades Process Equipment Performance and Control Room Decisions
Sensor drift occurs when a measurement device produces readings that gradually deviate from true process values due to fouling, calibration decay, electrical interference, or mechanical wear. Unlike sudden failures, drift happens incrementally—making it easy to miss until bad data has already influenced control loops, maintenance decisions, and production outputs. Book a Demo to see how Oxmaint's condition monitoring platform detects early drift signatures across your sensor network. A temperature sensor drifting 2°C per week may seem minor, but in a process with tight thermal tolerances it can trigger avoidable scrap runs, missed quality windows, or protective shutdowns based on phantom exceedances. The same principle applies to pressure transmitters, flow meters, and level sensors throughout plant operations.
Root Causes of Sensor Drift in Process Equipment: What Your Dashboard Must Track
A sensor drift detection dashboard is only as effective as the failure modes it accounts for. Plant teams that monitor raw process values without tracking sensor-specific health indicators miss the diagnostic signals that separate drift from real process changes. Sign Up Free to build equipment-level sensor health profiles inside Oxmaint and start detecting drift at the asset level, not just the tag level.
Sensors shift from factory calibration over time due to thermal cycling, vibration, and chemical exposure. Scheduled recalibration intervals that don't account for actual drift rate leave gaps where measurement error accumulates undetected.
Process media deposits on sensing elements alter response characteristics for pressure, flow, and temperature instruments. Drift from fouling typically accelerates progressively, making early trend detection essential for scheduling cleaning interventions.
Electrical noise from motor starts, grounding faults, and cable degradation introduces bias and noise into sensor signals. These interference patterns show up as erratic readings that standard threshold alarms misclassify as process events.
Rotating or moving sensing components—flow meter impellers, valve position sensors, level floats—experience mechanical wear that changes measurement accuracy gradually. Vibration analysis and maintenance history correlation help distinguish wear-driven drift from process variation.
Sensor Drift Detection Dashboard Components: What to Monitor and How Often
Building an effective drift detection capability requires tracking the right signal features, comparing against the right baselines, and routing alerts to the right people. Plant teams that rely solely on high/low process alarms miss systematic drift entirely. Book a Demo to see how Oxmaint integrates sensor telemetry with PM scheduling and alert routing to support structured drift management.
| Dashboard Component | Drift Indicator Tracked | Detection Method | Review Frequency | Action Trigger |
|---|---|---|---|---|
| Signal Baseline Trend | Slow upward or downward shift from historical mean | Moving average deviation analysis | Daily automated | >2σ shift over rolling 7-day window |
| Calibration Age Tracker | Days since last verified calibration vs. drift history | CMMS calibration records integration | Weekly | Calibration interval exceeded or drift rate accelerating |
| Cross-Sensor Validation | Disagreement between redundant or correlated sensors | Differential comparison against process model | Continuous | Persistent disagreement >defined tolerance |
| Noise Floor Monitoring | Signal variance increase indicating electrical degradation | Standard deviation trending on stable process periods | Daily automated | Noise floor doubles from baseline |
| Response Lag Detection | Delayed response to known process step changes | Step response time comparison vs. commissioning baseline | Monthly | Response time exceeds 150% of design spec |
| Sensor Health Score | Composite drift risk combining all above indicators | Weighted scoring model with maintenance history | Real-time | Health score drops below defined threshold |
Implementing Sensor Drift Monitoring Using CMMS and Condition-Based Maintenance
Sensor drift management without a connected maintenance platform creates data silos where calibration records, alert histories, and work orders exist in separate systems. When drift is detected, the ability to instantly view calibration history, schedule a technician, and log corrective findings is what separates reactive firefighting from systematic reliability improvement. Sign Up Free and connect your sensor telemetry to Oxmaint's equipment health and work order management platform.
- Register every process sensor as a child asset under its parent equipment in Oxmaint
- Document sensor type, manufacturer specs, calibration interval, and baseline signal characteristics
- Link historical calibration records and maintenance findings to each sensor asset
- Set drift thresholds based on process criticality and sensor accuracy specifications
- Configure cross-sensor comparison rules for redundant measurement points
- Route drift alerts to reliability engineers with full sensor history context attached
- Generate automatic calibration work orders when drift indicators exceed thresholds
- Attach sensor health scores and recent trend data to every calibration work order
- Update calibration schedules dynamically based on observed drift rates rather than fixed intervals
- Monitor sensor fleet health scores to identify systemic drift patterns by equipment type
- Measure false alarm rate reduction as drift baselines are refined over time
- Report calibration compliance and drift-related work order closure rates to plant leadership
Sensor Drift Patterns in Process Equipment: Common Failure Signatures
Sensor Drift Detection KPIs for Process Plant Operations
Quantifying drift management performance requires tracking indicators that connect sensor health to process outcomes, not just calibration compliance. Sign Up Free to access Oxmaint's asset health dashboards and build sensor KPI tracking across your entire process equipment fleet.
Composite health score across all monitored sensors. Declining fleet health predicts increased false alarms and process deviations before they occur.
Alarms triggered by drifted sensors rather than real process events. Drift-adjusted baselines should progressively reduce this ratio as the monitoring program matures.
Percentage of sensors calibrated within their scheduled interval. Low compliance predicts drift accumulation risk across the process equipment fleet.
Average time from drift onset to detection and work order creation. Shorter detection cycles reduce exposure to process decisions made on corrupted measurements.
Process quality events or shutdowns traceable to sensor measurement error. Each occurrence represents a failure of the drift detection program and a quantifiable cost impact.
Frequency of redundant sensor pairs exceeding disagreement tolerances. Persistent disagreement rates signal either process instability or systematic calibration gaps requiring investigation.