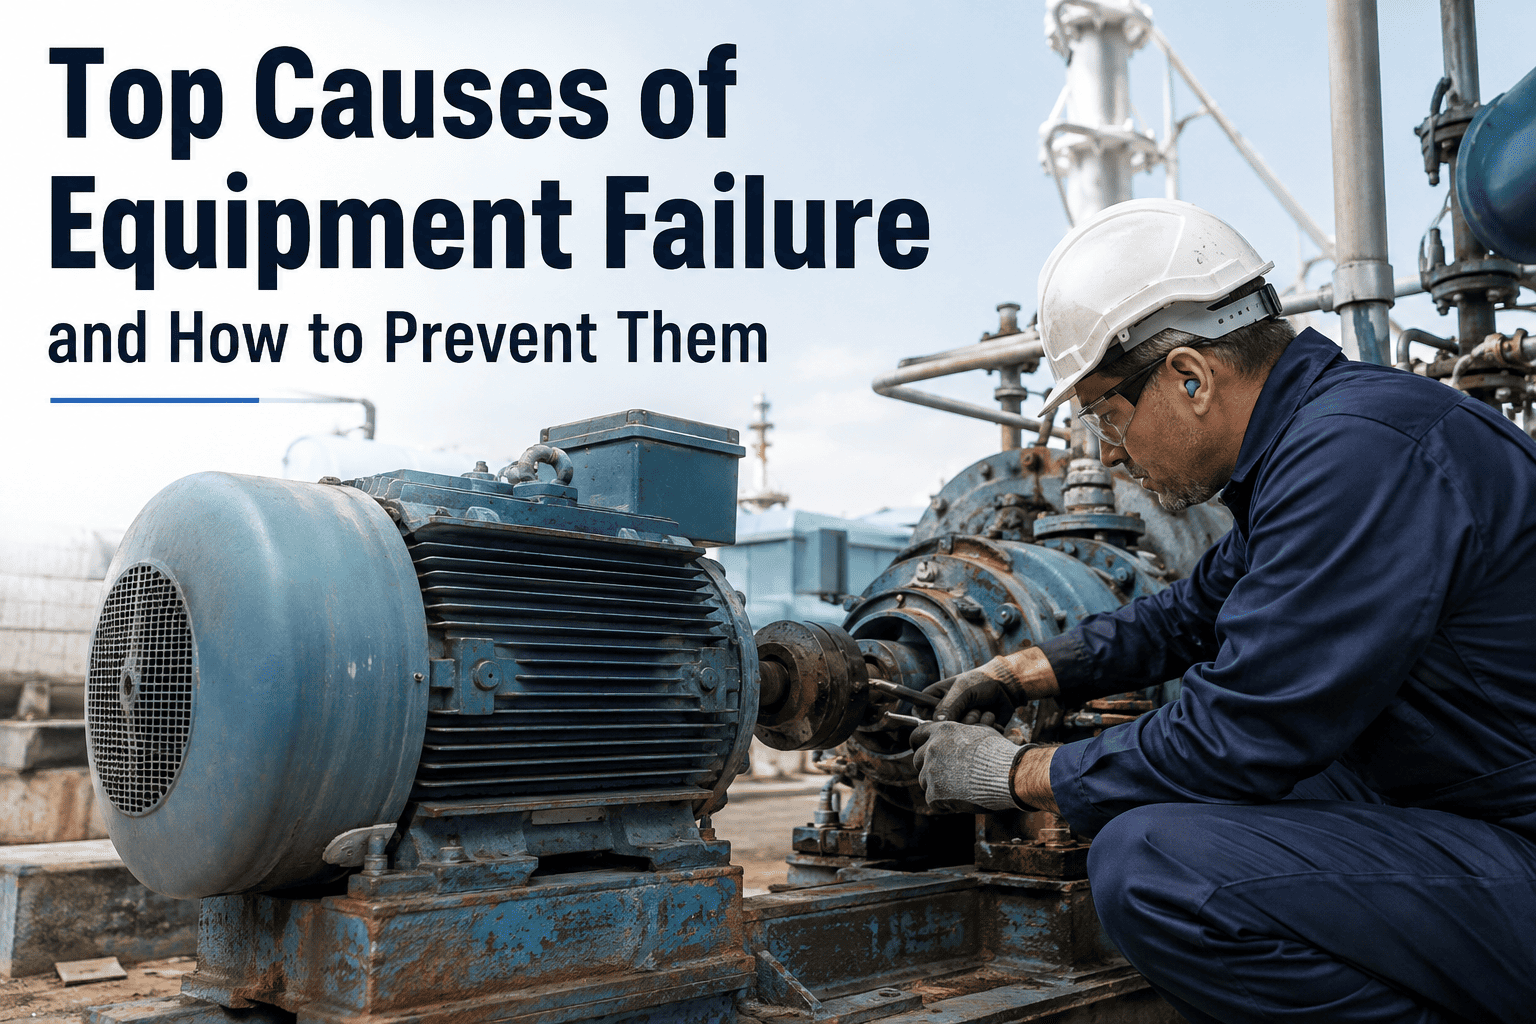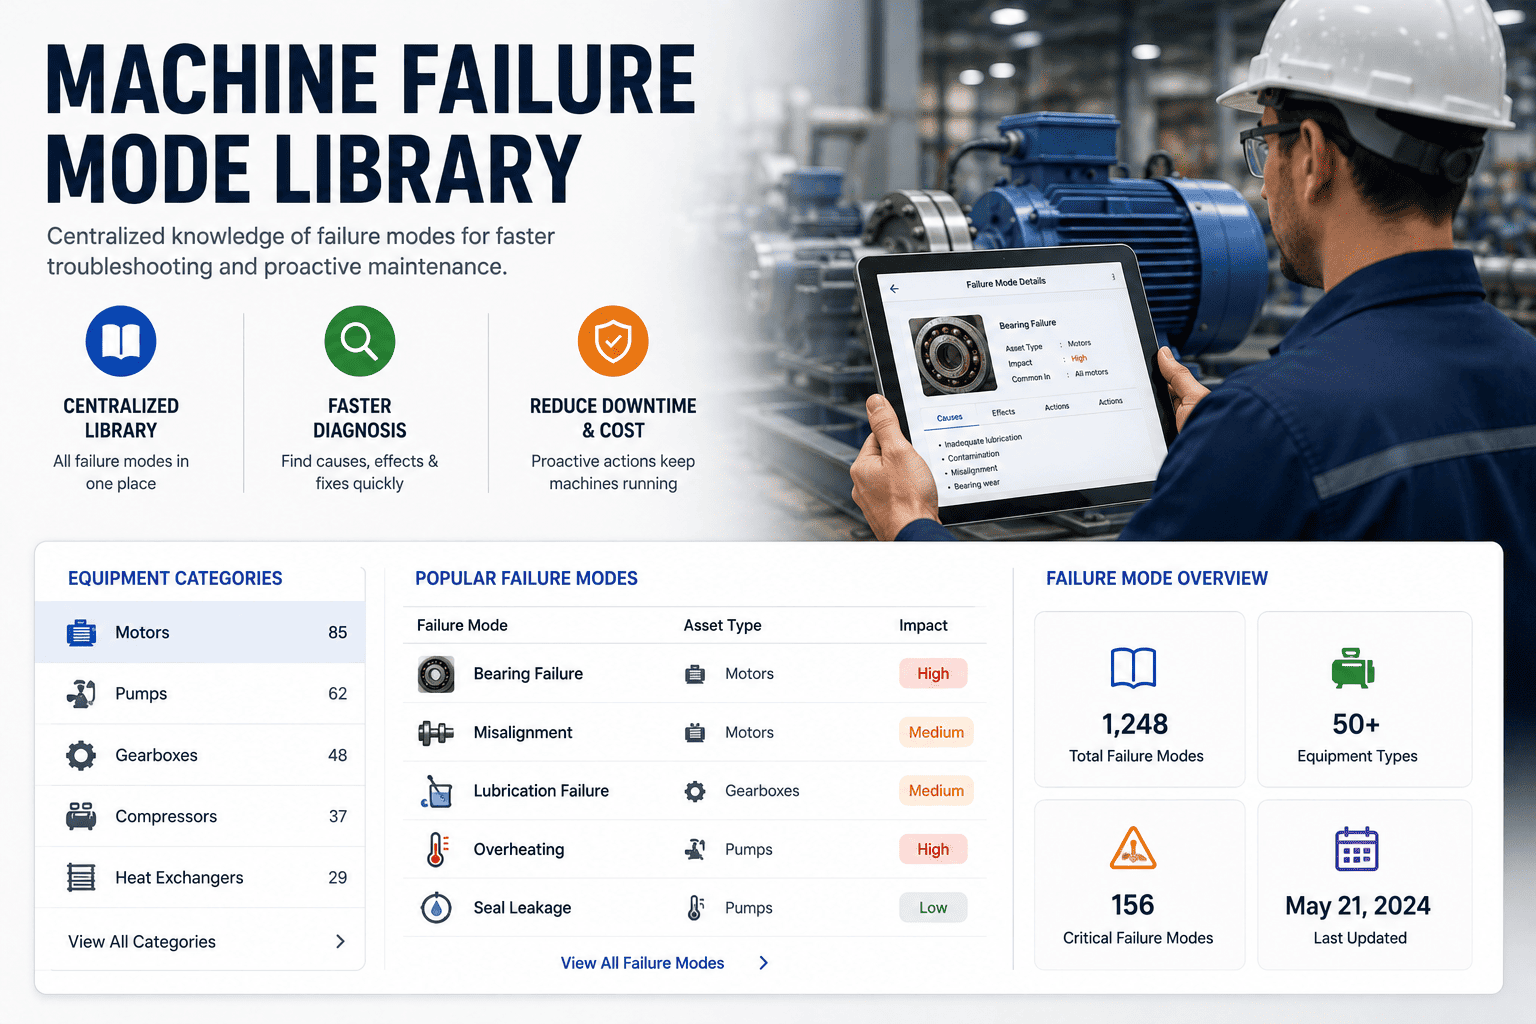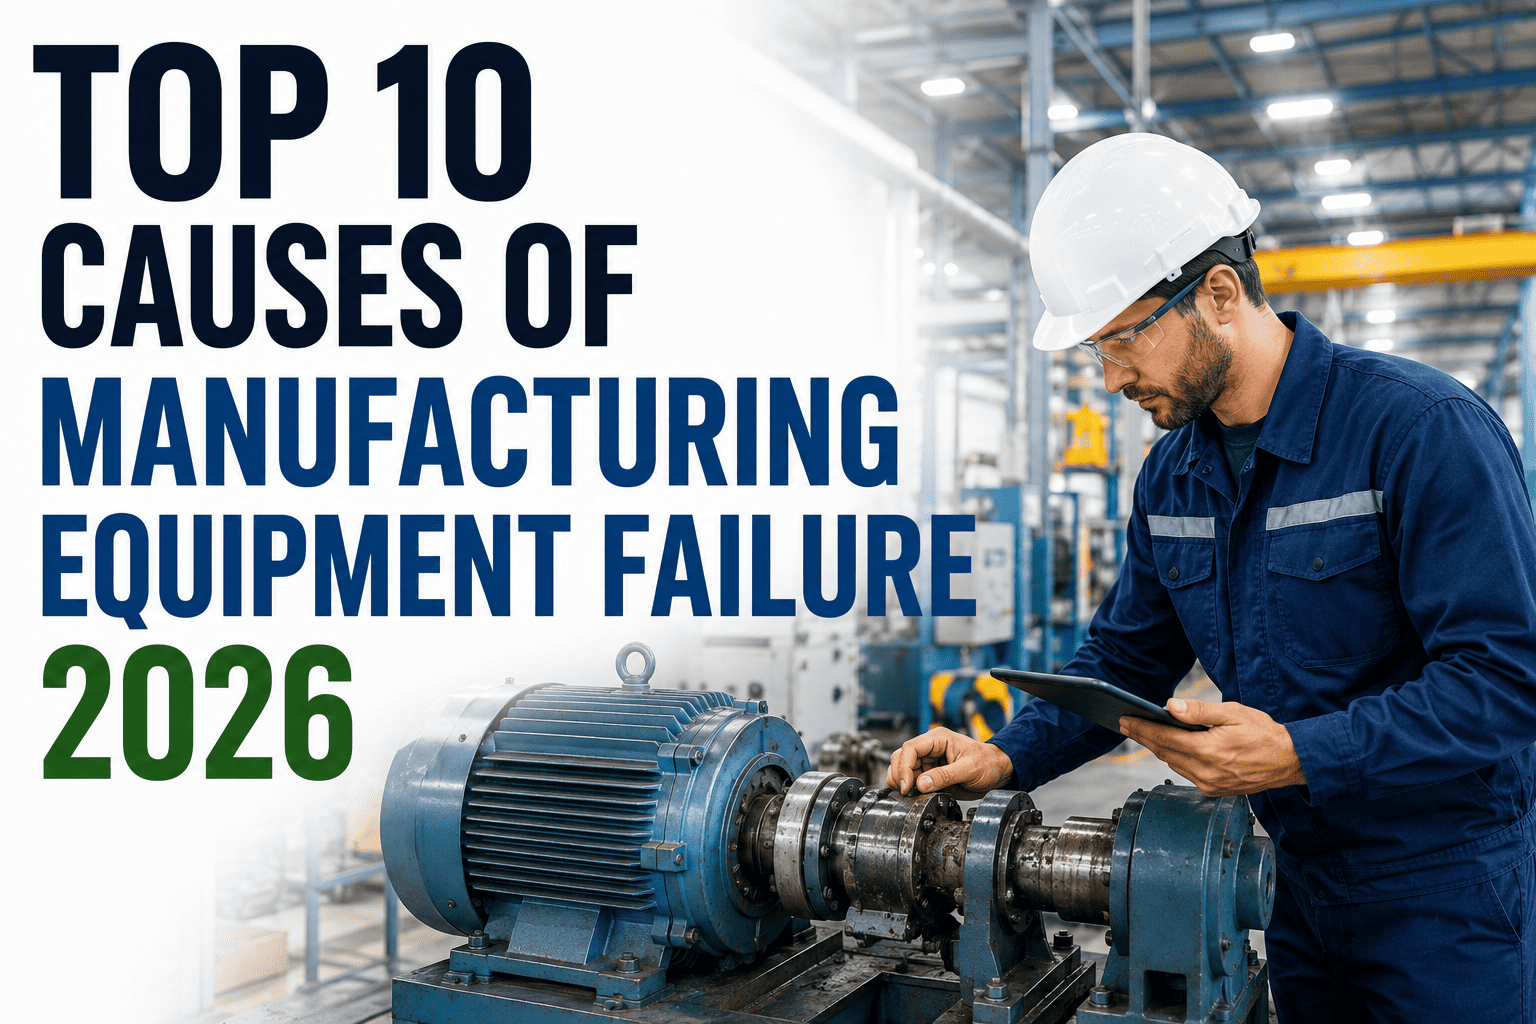
Unplanned downtime costs industrial manufacturers an estimated $50 billion every year, and roughly eight in ten stoppages trace back to the same handful of equipment failure causes. From lubrication breakdown and bearing wear to contamination, misalignment, and thermal stress, these recurring failure modes are predictable — and largely preventable when a CMMS captures the right condition data. This guide ranks the top 10 causes of manufacturing equipment failure in 2026, pairs each with its root-cause mechanism and countermeasure, and shows how modern maintenance teams use CMMS analytics to move from reactive firefighting to predictive uptime. Start Free Trial to put these countermeasures on autopilot inside your plant.
What if 80% of your unplanned downtime came from just 10 fixable causes?
Across hundreds of audited plants, the same ten failure mechanisms drive the overwhelming majority of lost production hours — and most begin months before the breakdown. Here is exactly where they hide, what they cost, and how to stop them with the right CMMS data.
The 10 Causes Driving Plant Equipment Failure in 2026
Each cause below is ranked by its share of unplanned downtime events logged in CMMS work orders across discrete and process manufacturing. For every cause you get the mechanism, the early warning signal, and the countermeasure that closes the gap.
Lubrication Failure
~25% of failuresWrong viscosity, over-greasing, under-greasing, or contaminated lubricant starves metal-on-metal surfaces of film strength. Friction spikes,-welding, and spalling follow within weeks. Countermeasure: auto-lubricators tied to runtime meter readings, oil analysis every 90 days, and CMMS triggers that open a work order when grease intervals slip by more than 10%.
Bearing Wear & Fatigue
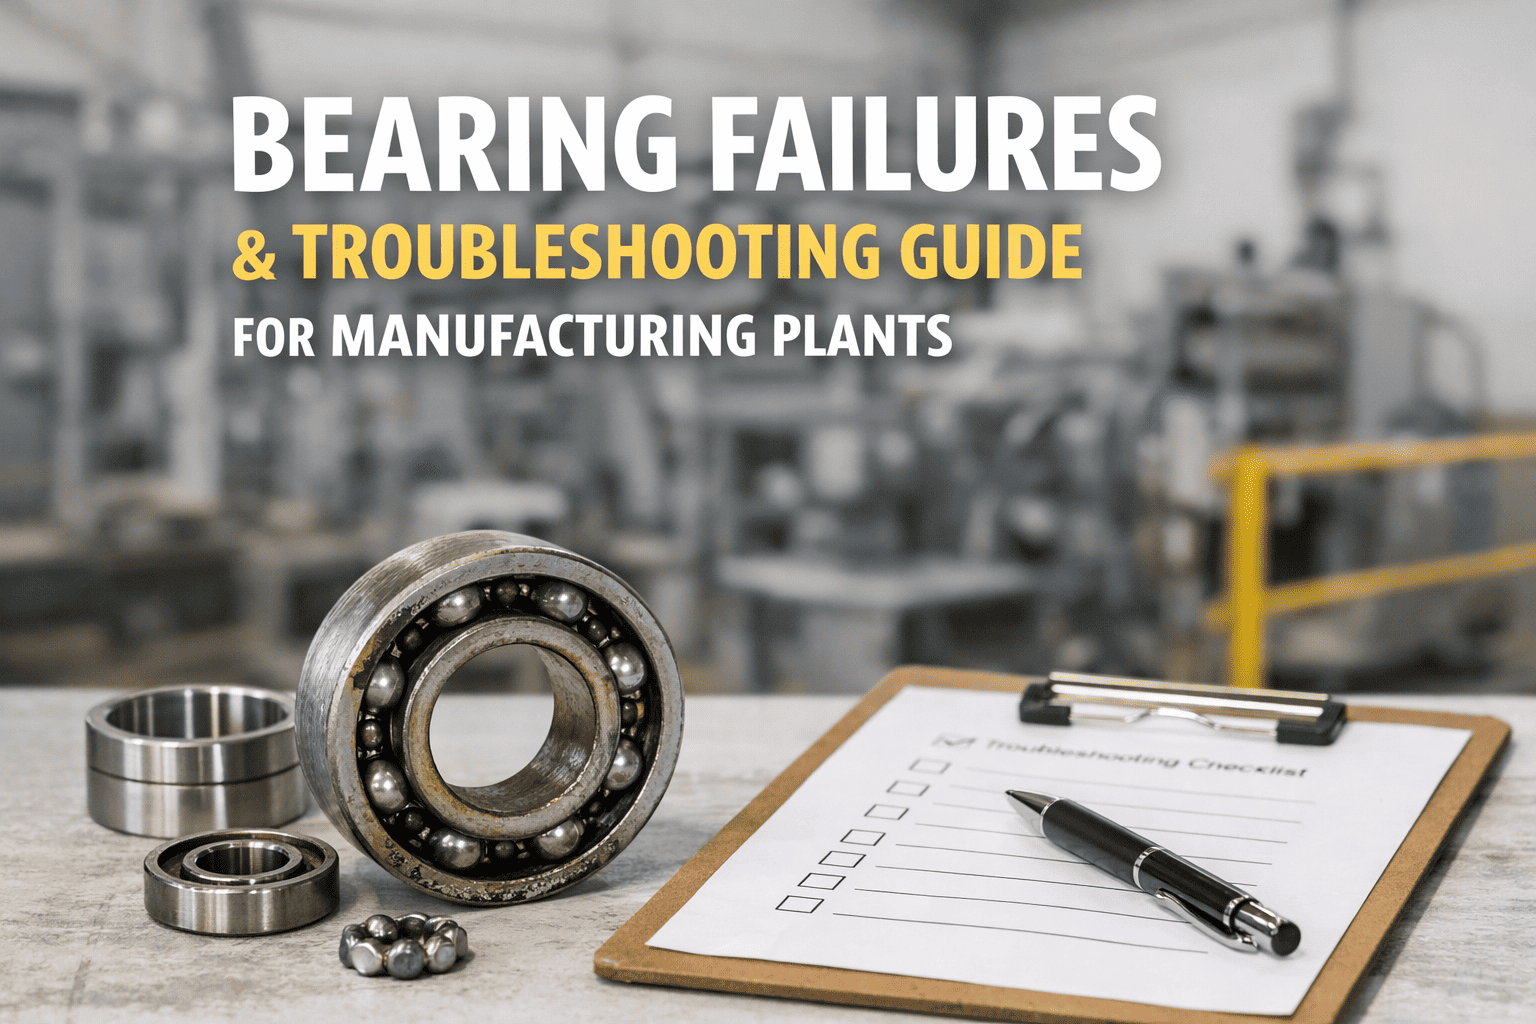
~16% of failuresBearings fail from lubrication loss, misalignment, false brinelling, and overloading. Vibration in the 1–10 kHz envelope band rises 6–12 weeks before spalling. Countermeasure: ISO 10816 vibration monitoring, ultrasonic trending, and replacement at 70% of calculated L10 life — not run-to-failure.
Contamination (Particulate & Moisture)
~14% of failuresDirt, dust, metal shavings, and water ingress destroy hydraulic systems, gearboxes, and servo packs. A hydraulic fluid at 0.1% water content halves bearing life. Countermeasure: desiccant breathers, offline kidney-loop filtration to ISO 4406 cleanliness targets, and CMMS-logged particle counts above alarm thresholds.
Overheating & Thermal Stress
~11% of failuresWhen operating temps exceed rated limits by 10°C, insulation life in motors halves (Arrhenius rule), and seal elastomers harden. Cooling fans clog, heat exchangers foul, and coolant degrades. Countermeasure: continuous thermal sensors on motor windings and bearing housings, with CMMS alerts above 80°C — and a clean-cooling-loop PM every 30 days.
Misalignment & Imbalance
~9% of failuresShaft angular or parallel misalignment beyond 0.05 mm causes radial loads that chew through couplings and bearings. Imbalance above ISO 1940 G6.3 sets off 1× RPM vibration. Countermeasure: laser alignment at every coupling reassembly, field balancing during installation, and quarterly vibration route checks.
Electrical & Sensor Faults
~8% of failuresLoose terminals, VFD-induced bearing currents, and failed proximity sensors cause intermittent faults that are notoriously hard to trace. Countermeasure: annual thermographic surveys of panels, shaft grounding rings on VFD-driven motors, and CMMS-calibrated sensor health checks every 60 days.
Human Error & Procedural Lapses
~7% of failuresBypassed safeties, skipped torque sequences, wrong spare installed, or "adjust-on-the-fly" tweaks cause instant damage. Countermeasure: digital SOPs enforced through a CMMS mobile app, QR-coded work instructions at the asset, and mandatory sign-off with photo evidence before equipment restart.
Aging Assets & End-of-Life Wear
~5% of failuresAssets past 15–20 years of service see cascading failures in seals, gaskets, and electrical insulation. Countermeasure: lifecycle cost analysis in the CMMS, criticality-weighted replacement planning, and a capex-vs-repair threshold set at 65% of replacement value.
Design & Specification Errors
~3% of failuresUndersized motors, mismatched couplings, and material incompatibility cause chronic repeat failures on the same asset tag. Countermeasure: root-cause failure analysis (RCFA) on every third repeat failure, and an engineering-change workflow linked to the asset record in the CMMS.
Environmental & Operating Stress
~2% of failuresHumidity swings, corrosive atmospheres, vibration transmitted from neighbouring machines, and ambient dust all shorten component life. Countermeasure: environmental zoning in the CMMS asset registry, corrosion-resistant coatings, and isolation pads engineered to the floor's natural frequency.
Early Warning Signals and the CMMS Response
Catching a failure mode in its warning window costs 5–10× less than responding after the breakdown. Use this matrix to wire the right sensor signal to the right work-order trigger inside your CMMS.
| Failure Cause | Early Warning Signal | Detection Window | CMMS Countermeasure |
|---|---|---|---|
| Lubrication failure | Oil particulate > ISO 4406 22/20/17 | 8–12 weeks | Auto-trigger oil change + filter PM |
| Bearing wear | Envelope acceleration > 12 g | 6–10 weeks | Open predictive work order, schedule swap |
| Overheating | Winding temp > 80°C sustained | 2–4 weeks | Dispatch cooling-loop inspection |
| Misalignment | 1× / 2× RPM vibration phase shift | 4–8 weeks | Schedule laser alignment PM |
| Electrical fault | Hotspot > 15°C over ambient in IR scan | 2–6 weeks | Thermographic survey + terminal retorque |
| Contamination | Water content > 200 ppm in oil | 6–10 weeks | Kidney-loop filtration + desiccant swap |
What a 180-Asset Plant Really Pays by Ignoring These 10 Causes
Consider a mid-sized discrete manufacturer running 180 critical assets across three production lines. Without condition-based monitoring, they fall into the typical reactive pattern: 60% of work orders are unplanned, MTBF hovers at 18 months, and one major breakdown per month costs an average of $14,000 in parts, overtime, and lost throughput.
For the 180-asset plant above: 36 events × $14,000 + (126,000 min × $2.80/min) = $856,800 per year in avoidable cost — recovered in under 9 months once CMMS-driven countermeasures are live.
From 12 Breakdowns a Month to One
A 320-asset food packaging plant implemented CMMS-routed vibration and oil analysis on their top 30 critical assets. Within six months, the same 10 failure causes that had dominated their downtime log were caught in the warning window 84% of the time.
"We stopped replacing bearings after they failed and started replacing them when vibration told us to. Our unplanned downtime dropped 78% in the first year, and the CMMS paid for itself before the first quarterly review."
Ready to stop fighting the same 10 failures every quarter?
Deploy condition-based countermeasures, automated PM triggers, and failure-mode analytics — all inside one CMMS built for manufacturing reliability teams.
Common Questions About Manufacturing Equipment Failure
Which single cause drives the most equipment failure in manufacturing plants?
Lubrication failure is consistently the number-one cause, accounting for roughly 25% of all unplanned downtime events. It is also the cheapest to prevent — proper grease intervals, oil analysis, and auto-lubricators tied to CMMS runtime meters typically cut lubrication-related failures by 70% within the first year of implementation.
How does a CMMS help prevent the top 10 failure causes?
A CMMS captures vibration, oil, thermal, and runtime data from connected sensors and automatically opens work orders when thresholds breach — long before the asset fails. It also enforces PM schedules, standardizes SOPs, and builds a failure-history record that feeds back into ISO 55000-aligned reliability programs. To see it in action, Book a Demo and we will map your top failure causes live.
What is the typical payback period for condition-based monitoring on these failure modes?
Most mid-sized plants (150–400 critical assets) see a payback period of 6–12 months after deploying CMMS-driven condition monitoring. The savings come from cutting reactive repair costs (typically 5× more expensive than planned work), reducing downtime minutes, and extending asset life by 20–40% through earlier intervention.
Are the top 10 failure causes the same across all manufacturing industries?
The core ten — lubrication, bearing wear, contamination, overheating, misalignment, electrical faults, human error, aging, design, and environment — appear in nearly every plant, but the weighting shifts. Food and beverage plants see more contamination and washdown-related failures, while heavy metals plants see more thermal and overload events. A CMMS asset-criticality analysis tailors the countermeasures to your specific mix.
How quickly can a plant start seeing results after implementing these countermeasures?
Plants that deploy CMMS-routed PMs and sensor-based alerts on their top 20–30 critical assets typically see a 30–50% reduction in unplanned downtime within the first 90 days. The fastest wins come from lubrication, contamination, and overheating countermeasures, because their warning windows are long and the fixes are inexpensive. You can Start Free Trial today and have your first failure-cause dashboard live before the week is out.
Turn the Top 10 Failure Causes Into Your Top 10 Wins
OxMaint gives you the CMMS workflows, sensor integrations, and failure-mode analytics to catch every one of these causes before it costs you a production hour.
Free 14-day trial · No credit card