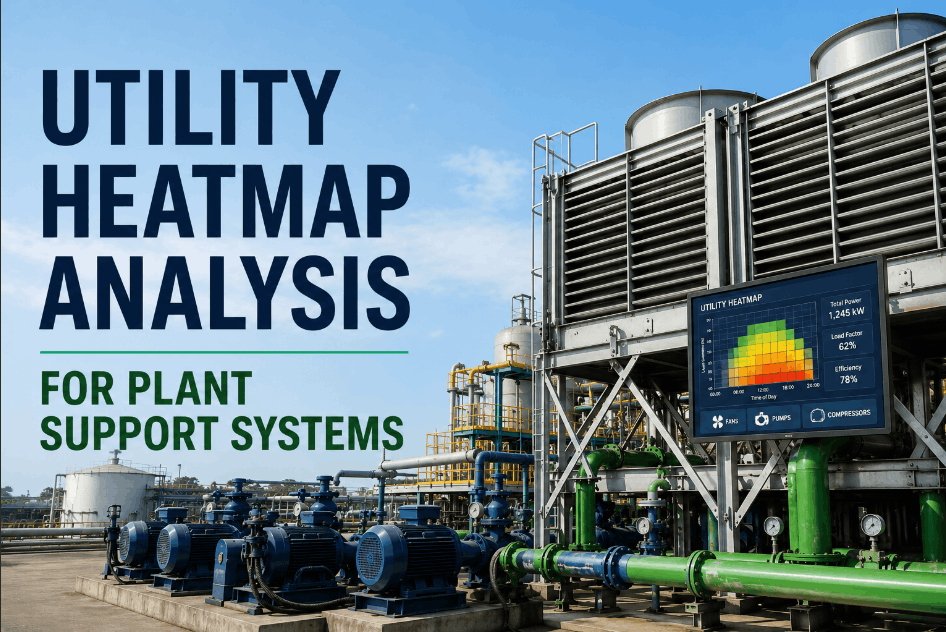
Plant support systems — fans, pumps, compressors, HVAC units — are the infrastructure that keeps production environments operational. They also account for a disproportionate share of facility energy consumption, and their inefficiencies accumulate silently. A compressor running at 15% above its design load factor, a cooling fan with a blocked filter, a pump operating on a worn impeller — each draws more power than it should, but none trigger an alarm. Utility heatmap analysis correlates energy consumption patterns with support equipment behavior to surface the systems consuming more than their operating condition justifies. Sign Up Free to connect your utility and equipment records in Oxmaint and begin identifying support systems with abnormal power draw. Oxmaint AI links equipment operating data and maintenance records to utility consumption history — giving facilities and maintenance teams the correlation layer needed to expose energy waste driven by equipment condition rather than production demand. Book a Demo to see how utility heatmap analysis flows from Oxmaint equipment records into energy performance dashboards.
Find the Support Systems Quietly Consuming More Power Than They Should
Oxmaint AI correlates utility consumption with fan, pump, and compressor behavior — exposing support equipment with abnormal power draw before energy waste compounds into avoidable operating cost.
Why Utility Waste in Plant Support Systems Goes Undetected
Gap #1
Energy Metered at Facility Level Only
Total facility utility consumption is tracked but not allocated to individual support systems — making it impossible to identify which fan, pump, or compressor is driving elevated energy use without sub-metering each circuit.
Gap #2
Equipment Condition Not Linked to Power Draw
Maintenance records and energy consumption data are held in separate systems — so a pump with worn impellers consuming 20% more power than design specification never appears in any energy efficiency report.
Gap #3
Load Factor Baselines Not Established
Without a documented baseline power draw for each support system at known operating conditions, there is no reference point against which current consumption can be assessed as normal or abnormal.
Gap #4
Seasonal and Demand Variation Unaccounted
Support system energy use varies with ambient conditions and production load — but without controlling for these variables in energy analysis, legitimate demand-driven variation is indistinguishable from inefficiency-driven excess consumption.
Gap #5
No Heatmap Visibility Across Equipment Fleet
Energy data is reviewed as aggregate totals rather than as a comparative map across support equipment — missing the relative performance view that reveals which systems are outliers within the same equipment class.
Gap #6
Maintenance Intervention Not Linked to Energy Outcome
When maintenance is performed on a support system, its energy impact is never verified — so teams cannot confirm that a filter replacement, impeller swap, or alignment correction actually reduced the system's power draw.
How Oxmaint AI Builds Utility Heatmaps for Plant Support Systems
01
Utility Consumption Logging
Energy consumption data is recorded per support system circuit in Oxmaint — establishing per-equipment power draw records that can be tracked over time and compared against design load factor specifications.
→
02
Equipment Condition Correlation
Oxmaint links utility consumption records to equipment condition data from maintenance work orders — identifying support systems whose current power draw is inconsistent with their operating condition and maintenance history.
→
03
Heatmap Generation
Oxmaint maps energy consumption across the support equipment fleet — ranking fans, pumps, and compressors by normalized power draw to reveal which systems consume disproportionately relative to their rated capacity and operating hours.
→
04
Maintenance Intervention Targeting
High-consumption outliers identified in the heatmap are linked to Oxmaint work order creation — directing maintenance attention to the specific support systems where equipment condition improvement will deliver the greatest energy reduction.
What Oxmaint Captures Per Utility Heatmap Analysis Record
Energy Consumption
Power draw recorded per support system at regular intervals
Consumption normalized against operating hours and load factor
Baseline deviation flagged when consumption exceeds design specification threshold
Equipment Behavior
Fan, pump, and compressor operating parameters linked to consumption records
Condition indicators from inspections correlated with current power draw
Post-maintenance consumption compared against pre-intervention baseline
Heatmap Ranking
Support equipment fleet ranked by normalized consumption deviation
Top energy outliers surfaced automatically for maintenance review
Equipment class comparisons generated to identify systemic inefficiency patterns
Energy Outcome
Maintenance interventions targeted to highest-impact energy reduction opportunities
Energy savings from maintenance verified against pre-intervention consumption baseline
Support system energy performance tracked as a maintenance outcome metric
22%
Average excess power draw attributable to degraded condition in plant support equipment operating without condition-linked energy monitoring
2.8×
More targeted maintenance intervention when utility heatmap data identifies highest-consumption equipment outliers versus reactive fault reporting
48hrs
Typical time to deploy Oxmaint and begin correlating support system utility records with equipment condition and maintenance data
90days
Average period to establish statistically reliable consumption baselines per support system after Oxmaint utility tracking deployment
Oxmaint AI vs Standard CMMS for Support System Energy Visibility
Standard CMMS — No Energy-Maintenance Link
Energy data held in separate BMS or utility systems — no connection to maintenance records or equipment condition
Support system power draw not tracked per equipment — only aggregate facility consumption reported
No load factor baselines established — abnormal consumption has no reference point for comparison
Maintenance interventions not assessed for energy impact — energy savings from repairs go unmeasured
No comparative heatmap across support equipment fleet — outliers invisible without manual data assembly
Equipment condition deterioration not linked to power draw increase — inefficiency compounds undetected
Oxmaint AI — Utility Heatmap Intelligence
Utility consumption linked to equipment condition records from maintenance work orders in a single system — Sign Up Free
Per-equipment power draw tracked and normalized against operating hours and load factor
Consumption baselines established per support system — deviations flagged automatically for maintenance review
Post-maintenance energy impact verified against pre-intervention baseline — savings quantified per work order
Fleet-wide heatmap ranks support systems by consumption deviation — Book a Demo to see the ranking dashboard
Equipment condition deterioration correlated with power draw increase — early intervention triggered before waste compounds
6 KPIs to Measure Support System Utility Performance
These KPIs give facilities and maintenance teams the metrics to identify support systems with abnormal power draw, verify the energy impact of maintenance interventions, and build a fleet-wide picture of support system energy performance. Book a Demo to see how Oxmaint tracks all six from linked equipment and utility records.
KPI 01
Normalized Power Draw per Equipment
Actual power consumption per support system divided by operating hours and rated load factor. The primary indicator for identifying equipment consuming more energy than its operating condition and workload justifies.
Consumption Baseline
KPI 02
Consumption Deviation from Baseline
Percentage by which current power draw exceeds the established baseline for each support system at equivalent operating conditions. Deviations above threshold trigger maintenance investigation for equipment condition issues.
Deviation Monitoring
KPI 03
Fleet Heatmap Outlier Rate
Percentage of support equipment fleet operating above the normalized consumption threshold relative to peer equipment in the same class. Identifies systemic inefficiency patterns across fan, pump, or compressor populations.
Fleet Comparison
KPI 04
Maintenance Energy Reduction Rate
Average percentage reduction in power draw achieved following targeted maintenance interventions on high-consumption outlier equipment. Validates that maintenance activity translates into measurable energy performance improvement.
Intervention Outcome
KPI 05
Time to Detect Consumption Anomaly
Average time from the onset of abnormal power draw to detection and work order creation. Shorter detection times reduce cumulative energy waste and limit the condition deterioration that drives further consumption increase.
Detection Speed
KPI 06
Support System Energy Cost Per Operating Hour
Total utility cost attributed to plant support systems per production operating hour. Tracks whether energy performance improvements in the support equipment fleet translate into reduced energy cost per unit of productive output.
Energy Cost
Industries Using Oxmaint for Support System Energy Analysis
Process Manufacturing
Compressor and Cooling System Energy Performance Tracking
Chemical and refining plants use Oxmaint to correlate compressed air and cooling system consumption with compressor and heat exchanger condition data — identifying equipment whose degraded condition is driving utility overrun before it translates into process temperature or pressure variation. Sign Up Free for your facility.
Food and Beverage
Refrigeration and HVAC Energy Monitoring for Production Environments
F&B manufacturers use Oxmaint to track refrigeration compressor and HVAC unit power draw against equipment condition records — identifying systems consuming above baseline due to refrigerant charge issues, coil fouling, or fan belt wear before energy costs escalate. Book a Demo for your site.
Mining and Resources
Ventilation Fan and Dewatering Pump Energy Heatmapping
Mining operations use Oxmaint to map power draw across ventilation fan and dewatering pump fleets — identifying high-consumption outliers driven by impeller wear, blocked airways, or motor inefficiency and directing maintenance to the units with the highest energy reduction potential.
Utilities and Infrastructure
Pump Station and Fan System Energy Performance Verification
Water and power utilities use Oxmaint to verify pump station and cooling fan energy performance after maintenance — confirming that impeller replacements, bearing changes, and alignment corrections deliver the predicted power draw reduction and tracking energy performance as a maintenance outcome metric across the asset fleet.
Your Support Systems Are Consuming More Than They Should. Do You Know Which Ones?
Oxmaint AI correlates utility consumption with equipment condition data to surface the fans, pumps, and compressors consuming above baseline — giving maintenance and facilities teams the heatmap visibility to target interventions where they reduce energy waste most. Book a Demo to see utility heatmap analysis applied to your support equipment fleet.
Frequently Asked Questions
What is utility heatmap analysis for plant support systems?
Utility heatmap analysis maps energy consumption across a fleet of support equipment — fans, pumps, compressors — normalized by operating hours and load factor, to reveal which systems consume disproportionately relative to their rated capacity and current operating conditions.
How does Oxmaint link equipment condition to utility consumption?
Oxmaint connects maintenance work order records — inspection findings, condition notes, repair history — to per-equipment energy consumption data, identifying systems whose power draw increase correlates with degraded condition rather than changes in production demand.
Can Oxmaint verify energy savings from maintenance interventions?
Yes. Oxmaint compares post-maintenance power draw against the pre-intervention consumption baseline — quantifying the energy reduction achieved by specific maintenance activities and validating that repairs delivered the expected efficiency improvement.
How does Oxmaint account for seasonal variation in support system energy use?
Oxmaint normalizes consumption against operating conditions and load factor data, separating legitimate demand-driven variation from equipment-condition-driven excess consumption so energy analysis reflects true equipment performance rather than ambient load changes.
Can Oxmaint track utility heatmaps across multiple sites?
Yes. Oxmaint aggregates support system energy data across all facilities — enabling energy managers to compare normalized consumption across sites, identify best-performing equipment configurations, and standardize maintenance practices that deliver proven energy outcomes.
Stop Letting Support System Inefficiency Compound Undetected.
Oxmaint AI maps utility consumption across your fan, pump, and compressor fleet — correlating power draw with equipment condition to surface systems consuming above baseline and directing maintenance to where energy savings are greatest.