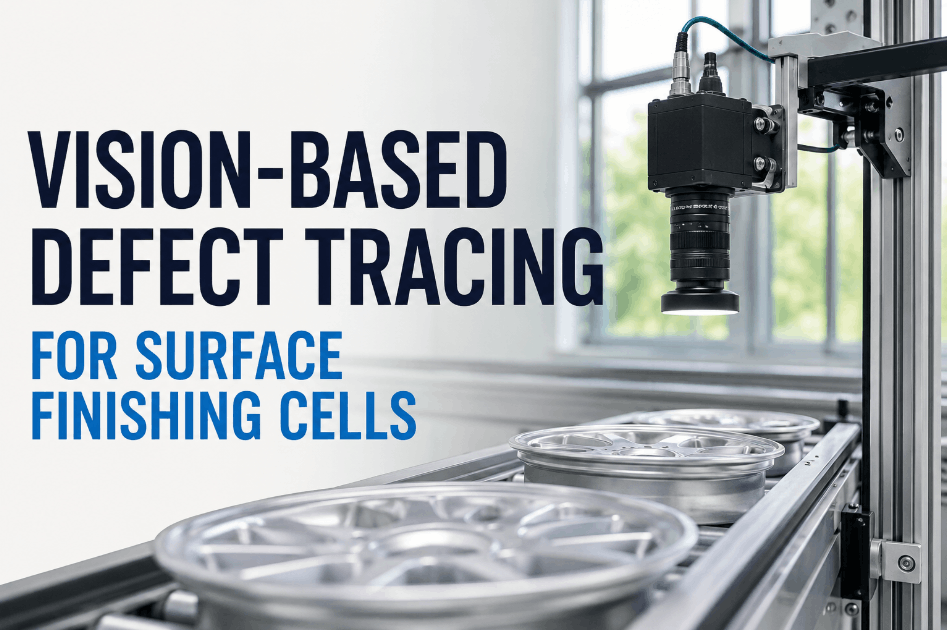
Surface finishing cells produce defects that are often invisible until they reach inspection or the customer — coating inconsistencies, handling marks, and tooling noise that develop progressively across a production run. Maintenance teams using Sign Up Free on OxMaint can log vision system alerts, track defect location patterns, and schedule corrective work orders before small quality deviations become repeat failure events. Machine vision defect tracing transforms reactive quality response into a structured maintenance discipline — connecting imaging data with asset history and work execution so finishing cell performance can be managed proactively, not discovered at end-of-line inspection or customer return.
Why Surface Finishing Defects Repeat Without Vision-Linked Maintenance
Most surface finishing cells generate defect reports — but few link defect location, type, and frequency back to the specific asset conditions that caused them. Without that connection, coating issues reappear after every PM cycle and handling marks cluster around the same cell positions run after run. Book a Demo to see how OxMaint connects machine vision alert data with work order history to close the loop between defect detection and maintenance correction.
Six Dimensions of Vision-Based Defect Tracing
Effective defect tracing goes beyond logging vision alerts. It connects coating failure patterns, handling mark clustering, tooling condition history, and process parameter data into a single maintenance intelligence picture. Sign Up Free on OxMaint to start linking machine vision outputs with your finishing cell work order system and build a defect trace baseline that drives proactive scheduling.
Defect Location and Type Classification
Machine vision systems detect surface anomalies across the part geometry — but their value depends on classifying defects by type and location. Mapping coating gaps, handling marks, and tooling noise to specific cell zones reveals spatial patterns that indicate fixture wear, spray head drift, or handling system misalignment.
Coating Consistency and Process Parameter Correlation
Coating defects often correlate with specific process parameter deviations — spray pressure, temperature, line speed, or viscosity drift. Correlating vision alerts with process logs identifies which parameter ranges consistently precede coating failure and where automatic alerts should trigger maintenance review.
Tooling Wear and Noise Pattern Monitoring
Tooling noise in vision data — micro-vibration artifacts, fixture chatter marks, and clamping inconsistency — increases progressively as tooling components wear. Tracking tooling noise index trends in OxMaint connects vision data to predictive tooling replacement schedules that prevent defect events rather than responding to them.
Handling Mark and Transfer Zone Fault Mapping
Handling marks cluster around part transfer, gripper, and conveyor contact zones. Mapping handling defect frequency by transfer position identifies where gripper wear, belt condition, or positioning drift is generating surface quality risk — enabling targeted corrective PMs without broad cell shutdown.
Defect Frequency Trending by Shift and Product Family
Defect rates that increase across a shift indicate progressive cell degradation. Trending vision alert frequency by shift, product family, and tooling configuration reveals degradation curves that allow maintenance teams to plan corrective interventions during scheduled downtime rather than emergency stoppages.
Vision-Linked Work Order Generation and PM Scheduling
OxMaint closes the loop between defect detection and maintenance action by linking vision alert thresholds to automatic work order generation and PM scheduling triggers. Teams stop waiting for manual defect reports to drive maintenance decisions — vision data drives the scheduling queue directly.
Defect Tracing Benchmarks by Surface Finishing Process
Defect accumulation patterns and maintenance response priorities differ significantly across finishing processes. Benchmarking your vision alert profile against process-specific risk ranges identifies which cells are highest priority for structured tracing programs. Book a Demo to see how OxMaint tracks defect alert data alongside finishing cell work order history in one platform.
| Finishing Process | Primary Defect Driver | Typical Alert Frequency | Risk Level | OxMaint Maintenance Lever |
|---|---|---|---|---|
| Liquid Coating Lines | Spray head drift, viscosity variance | 5–15 alerts per shift | High | Process parameter correlation + vision-linked PM triggers |
| Powder Coat Cells | Gun distance variation, grounding issues | 3–10 alerts per shift | Medium–High | Tooling condition monitoring + defect location trending |
| Anodizing Lines | Bath contamination, rack contact degradation | 2–8 alerts per run | Medium–High | Predictive bath condition alerts + work order auto-generation |
| Polishing and Buffing Cells | Wheel wear, fixture chatter, pressure inconsistency | 4–12 alerts per shift | Medium | Tooling noise index tracking + predictive replacement scheduling |
| Electroplating Lines | Anode depletion, current density drift | 2–6 alerts per run | High | Process parameter log correlation + shift-level defect trending |
How Untraced Defects Compound Finishing Cell Risk
Surface finishing defects that are detected but not traced compound through rework accumulation, accelerated tooling wear, missed PM windows, and repeat coating failure — each of which increases both quality cost and unplanned downtime exposure. Book a Demo to see how OxMaint connects vision data with asset history to surface compounding defect risk before it affects throughput and quality metrics.
Building a Vision-Based Defect Tracing Program with OxMaint
Register Finishing Cell Assets and Vision Alert Zones
Create asset records in OxMaint for each finishing cell with defect zone mapping — coating stations, transfer points, fixture positions, and inspection gates. This foundation enables spatial defect pattern analysis and links vision alerts to specific asset components.
Log Vision Alerts with Defect Type and Process Context
Capture vision alerts in OxMaint with defect classification, cell zone, product family, and active process parameters. Structured alert logging enables correlation analysis that manual quality reports cannot support at the frequency and volume finishing cells generate.
Configure Defect Frequency Thresholds and Work Order Triggers
Set defect frequency thresholds in OxMaint that automatically generate corrective work orders when alert rates exceed acceptable ranges by zone or defect type. Automated triggers replace manual defect review cycles and ensure tracing response is consistent across shifts.
Link Tooling Condition Data to Predictive PM Scheduling
Use OxMaint's asset history and vision trend data to trigger tooling PM tasks based on defect frequency accumulation rather than fixed calendar intervals. Condition-driven scheduling reduces coating failures without over-maintaining finishing cell components that show stable defect patterns.
Report Defect Trends Across Shifts and Product Families
Use OxMaint's reporting dashboards to track vision alert frequency, defect zone concentration, and process parameter correlation across shifts, finishing cells, and product families. Turn defect data into governance-ready quality reliability reports without manual aggregation.
Frequently Asked Questions: Vision-Based Defect Tracing
What is vision-based defect tracing for surface finishing cells?
Vision-based defect tracing uses machine vision alert data — classified by defect type, location, and frequency — to identify root cause patterns in finishing cell performance and drive targeted maintenance interventions that prevent repeat quality failures.
How does tooling noise affect surface finishing defect rates?
Tooling noise from fixture wear, chatter, and clamping inconsistency creates surface marks that appear as random defects in vision inspection. Trending tooling noise index data reveals progressive wear before it reaches the threshold that generates repeat defect events.
How does OxMaint support vision-based defect tracing?
OxMaint centralizes vision alert logging, maps defects to cell zones and asset components, triggers corrective work orders at defined alert thresholds, and generates defect trend reports — connecting machine vision data to maintenance scheduling in one platform.
What is the difference between coating inconsistency and handling mark defects?
Coating inconsistencies trace to process parameter deviations — spray pressure, viscosity, or temperature drift. Handling marks originate from gripper, conveyor, or fixture contact during part transfer. Each defect type requires a different maintenance response and tracing approach.
How often should finishing cell defect data be reviewed?
High-volume finishing cells benefit from shift-level defect frequency reviews; weekly analysis should cover zone concentration and tooling condition correlation. OxMaint automates both reporting layers so review cadence is maintained without additional quality planning overhead.