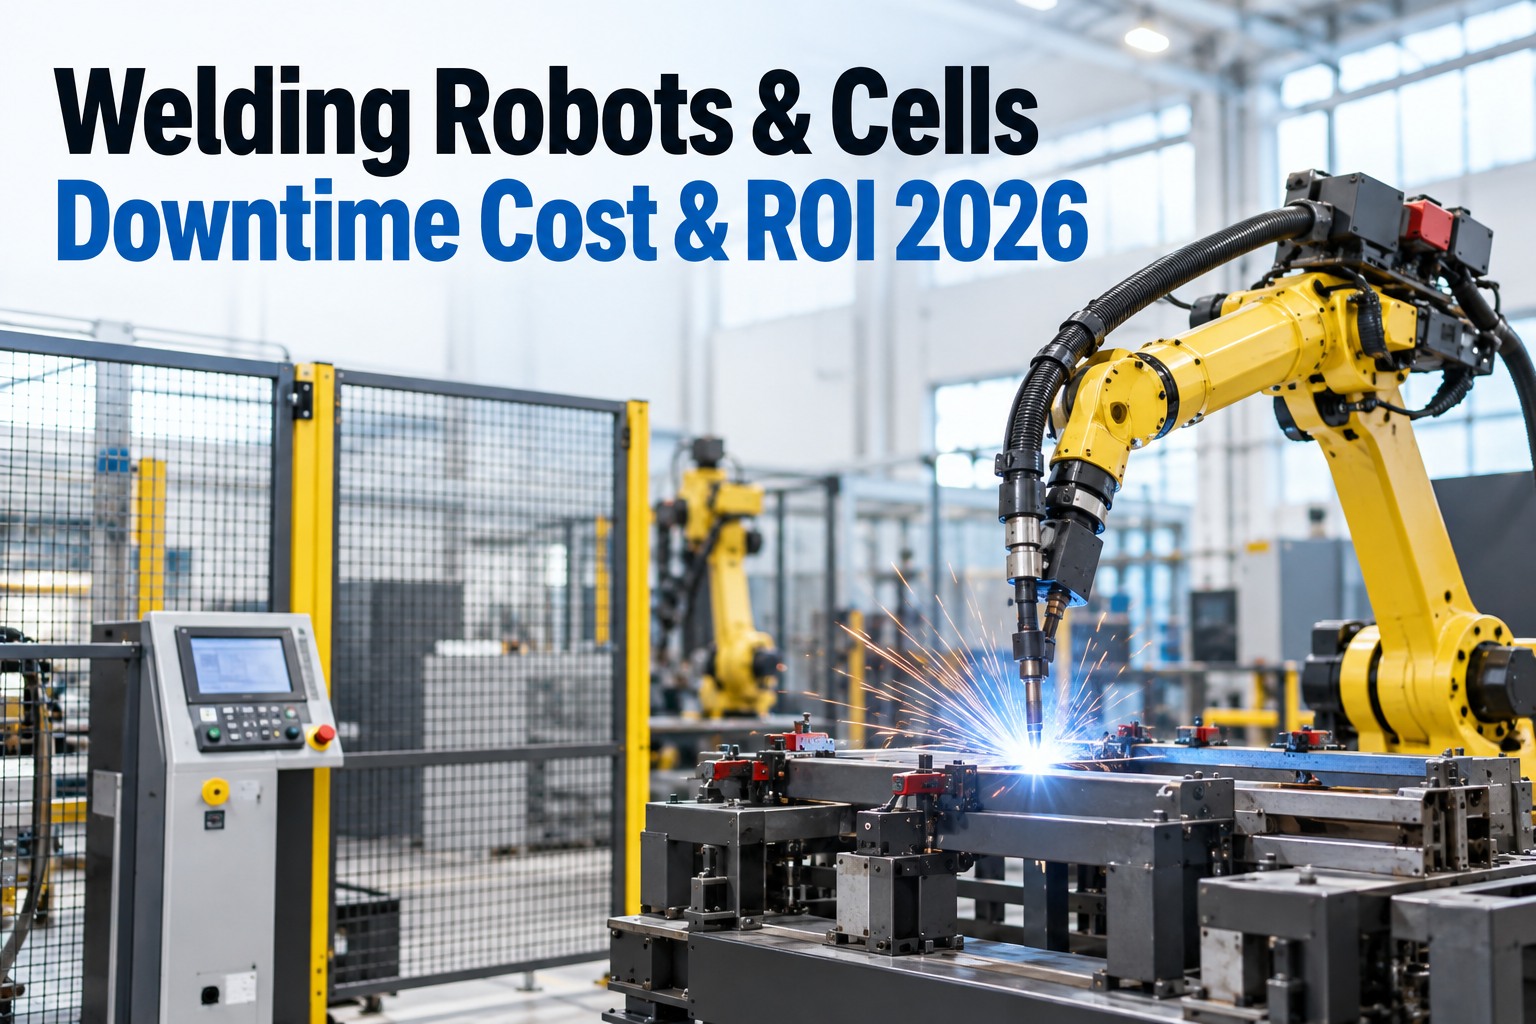
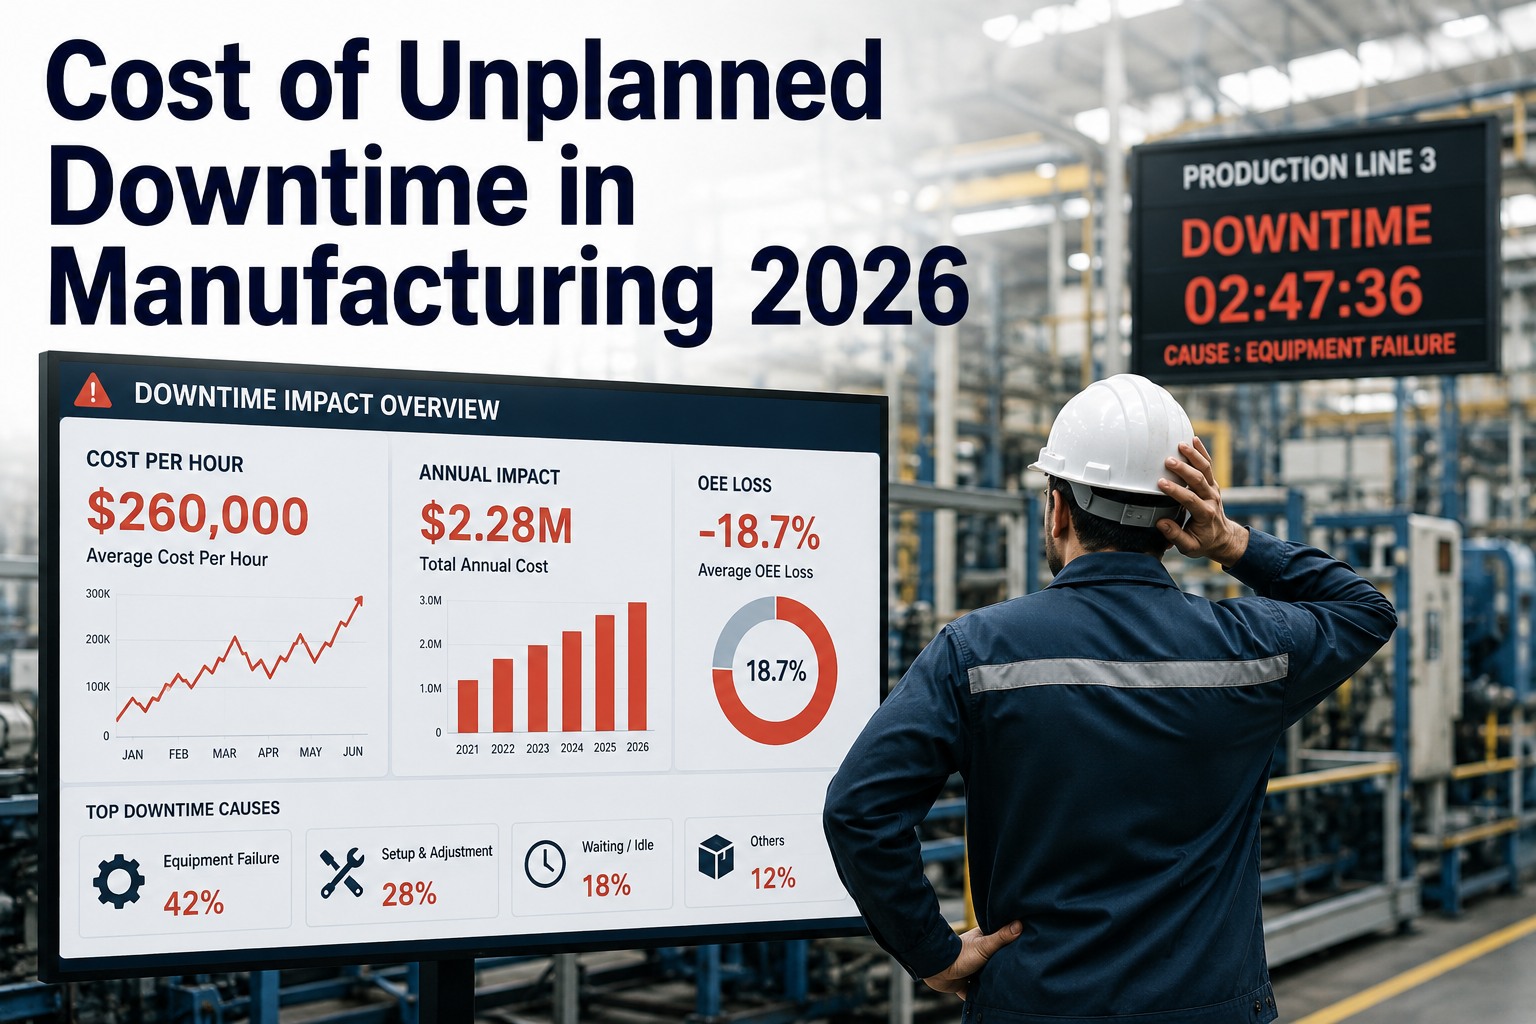
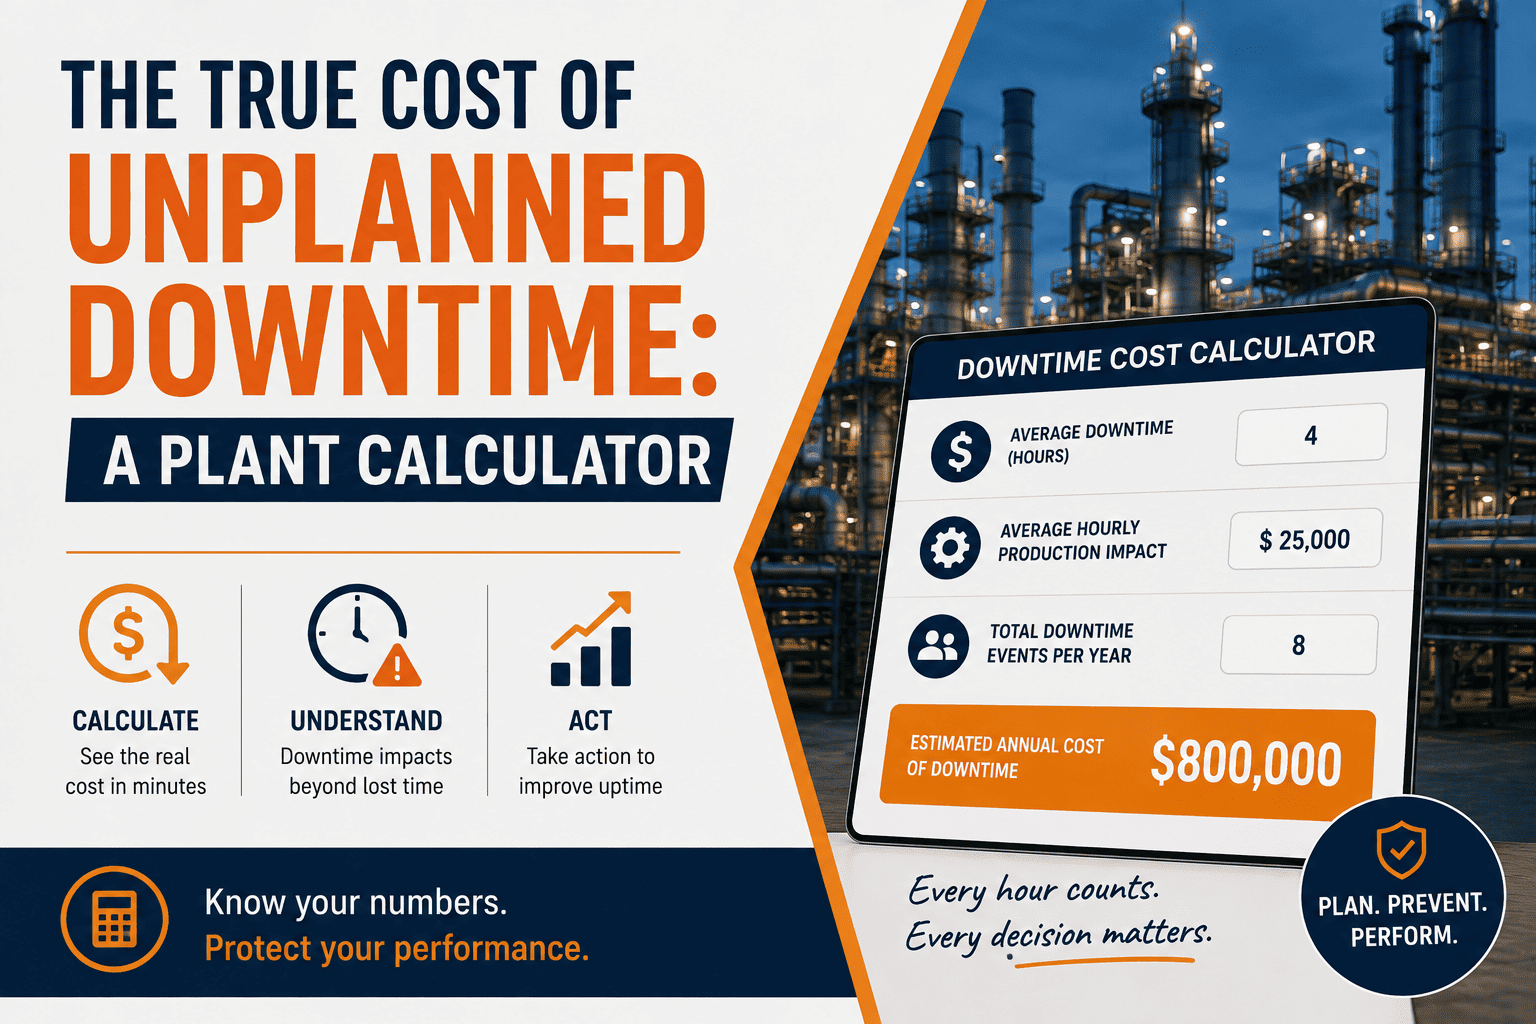
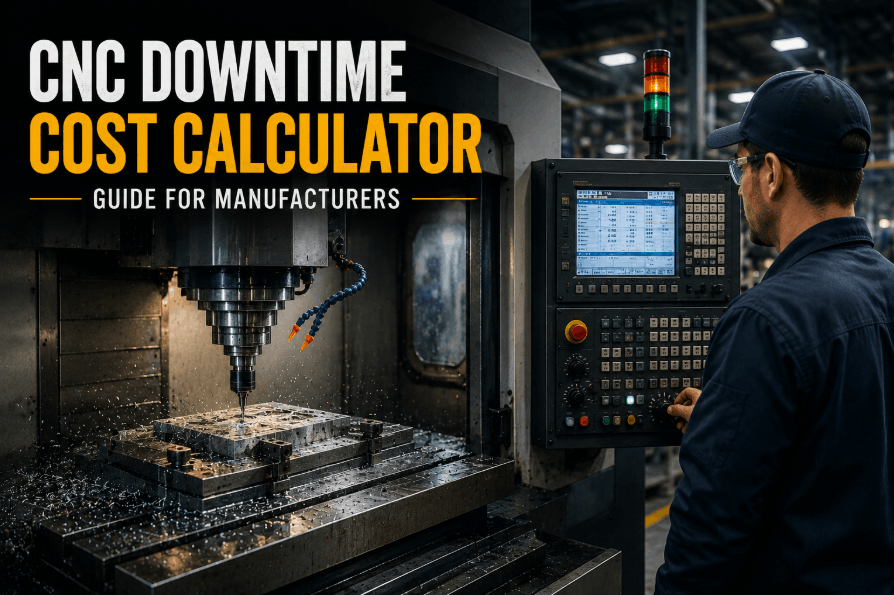
A welding cell doesn't fail quietly. When a robot faults mid-cycle, the whole line behind it stops — and the cost isn't just the idle robot, it's the starved downstream stations, the scrapped in-process welds, the missed takt, and the overtime to catch back up. Most plants dramatically underestimate this number because they only count the obvious part: the maintenance labor. The real cost of welding robots & cells downtime is a stack, and once you add the layers up, the business case for predictive maintenance stops being a debate. This 2026 guide breaks down exactly how to calculate downtime cost per hour, walks a real ROI example, and shows where OxMaint's maintenance management software turns that math into payback measured in weeks.
Manufacturing · Welding Robots & Cells · Downtime Cost & ROI · 2026
Welding Robots & Cells: Downtime Cost & Predictive Maintenance ROI
One faulted robot stops the whole line. Learn to calculate the true cost per hour — labor, scrap, starved stations, lost throughput — and see why predictive maintenance pays back in weeks, not years.
6 layers
of cost hidden inside one hour of welding-cell downtime
5–10×
gap between the labor cost most plants count and the true cost
Weeks
typical payback window for predictive maintenance on critical cells
1 formula
to turn "we should do PdM" into a number your plant manager signs
The Real Cost Stack of One Downtime Hour
Most downtime estimates count only the top layer — the maintenance labor to fix the robot. The true cost per hour is six layers deep, and the ones below the surface are usually the biggest. Here's the full stack. Sign up free and OxMaint captures every layer against the asset so your cost number is real, not guessed.
Visible
1 · Maintenance labor & parts
Technician hours plus the servo, cable, torch or controller part. The only layer most plants actually count.
Hidden
2 · Lost throughput
Units the cell would have welded in that hour, valued at their margin — the number that dwarfs the repair cost.
Hidden
3 · Starved & blocked stations
Every station upstream and downstream of the cell idles too. One robot down stops many workers.
Hidden
4 · Scrap & rework
In-process parts ruined by a mid-cycle stop, plus the bad welds from the run just before the fault showed.
Hidden
5 · Recovery & overtime
The premium to catch back up to schedule — expedited shipping, weekend shifts, overtime rates.
Hidden
6 · Missed-commitment risk
Late deliveries, penalty clauses, and the customer-confidence cost when a critical cell keeps stopping.
The Downtime Cost-per-Hour Formula
You don't need a consultant to size this — you need one line of math applied honestly. This is the formula that converts a vague "downtime is expensive" into a defensible per-hour figure. Book a demo to run it on your own cells.
A Worked ROI Example
Here's how the math plays out on a single critical welding cell. The point isn't the exact figures — plug in your own — it's how fast predictive maintenance pays for itself once the full cost stack is on the table. Start free and build the real version on your numbers.
Reactive today
Unplanned stops / month6
Avg. hours per stop3
True cost / hourhigh
Monthly downtime costpainful
→
With predictive PdM
Stops caught earlymost
Planned vs. unplannedflipped
Downtime hoursslashed
Payback periodweeks
Even avoiding a fraction of those unplanned hours covers the cost of the platform — which is why the payback lands in weeks, not years. The recovered throughput is pure upside on top.
The Cheapest Downtime Hour Is the One That Never Happens.
Every layer of the cost stack disappears if the fault is caught before it stops the line. A worn servo, a degrading cable, a drifting weld signature — these announce themselves in the data hours or days early, if something is watching. Predictive maintenance converts a line-stopping surprise into a planned, off-shift, five-minute part swap. That conversion is the entire ROI. OxMaint is where the watching happens.
What Actually Fails on a Welding Cell — and the Early Signal
Predictive maintenance works because welding-cell failures rarely happen without warning. Here are the common failure modes and the signal that precedes each — the data OxMaint watches so a fault becomes a scheduled fix. Book a demo to connect your cell data.
Servo / axis wear
Signal: rising vibration & current draw
Dress-pack / cable fatigue
Signal: intermittent faults, cycle-count age
Torch & consumable wear
Signal: weld-quality drift, spatter trend
Wire-feed inconsistency
Signal: feed-motor current variance
Controller / power faults
Signal: error-code frequency climbing
Fixture & clamp drift
Signal: positioning error, reject rate up
Reactive vs. OxMaint Predictive — the Numbers That Move
The ROI isn't one big lever; it's several metrics moving together once maintenance shifts from firefighting to forecasting. Here's what changes. Start free and move them on your own cells.
How OxMaint Delivers the Payback
Turning the cost stack into savings takes a platform that watches the data, raises the work order, and proves the result. Here's what does the work. Sign up free to build it on your line.
Condition & Vibration Monitoring
Live IoT and vibration data on servos, feeders and controllers surfaces the early signal before a fault stops the cell.
Predictive Work Orders
A degrading component auto-raises a planned WO scheduled for off-shift — the line-stop converted to a part swap.
Downtime & Cost Tracking
Every stop logged against the asset with its true cost, so your per-hour number is measured, not estimated.
OEE & Reliability Dashboards
Availability, MTBF and downtime trends per cell — the evidence that the PdM program is paying back.
Mobile Technician Execution
Work orders, history and parts on the phone at the cell, so planned fixes get done fast and captured cleanly.
Spare-Parts & PM Automation
Auto-generated PMs and stocked critical spares end the expedited-part premium that reactive plants keep paying.
"
Finance always waved off predictive maintenance as "nice to have." The unlock was the cost stack — when I showed that one three-hour cell stop wasn't the $400 repair we logged but closer to $12K once you counted the starved line, scrap and overtime, the whole conversation changed. We put vibration monitoring on our two most critical welding cells through OxMaint, and it flagged a failing servo a week out. We swapped it on a Saturday for the price of a part. That single avoided stop more than paid for the platform. The payback wasn't a projection anymore — it was a receipt.
Reliability Manager · Automotive Tier-1 Supplier
Frequently Asked Questions
How do I calculate welding-cell downtime cost per hour?
Add the lost throughput (units/hour × margin) to idle labor across starved stations, scrap and rework, and recovery/overtime — then include the repair. The throughput and starved-labor layers are usually far larger than the repair itself.
Why is the true cost so much higher than the repair bill?
Because a repair bill is one layer of six. A stopped welding cell also freezes the stations around it, scraps in-process parts, and forces premium recovery to hit schedule — costs that never appear on the maintenance ledger but hit the P&L.
How fast does predictive maintenance pay back?
On critical cells, typically weeks. Once the full cost stack is counted, avoiding even a fraction of unplanned hours covers the platform, and recovered throughput is upside on top — which is why the payback shows up as a receipt, not a forecast.
What welding-cell failures can be predicted?
Most of them announce themselves: servo and axis wear via vibration and current, dress-pack fatigue via intermittent faults, torch and consumable wear via weld-quality drift, and controller issues via rising error-code frequency.
How does OxMaint calculate and cut this downtime?
It monitors condition data live, auto-raises planned work orders on the early signal, and logs every stop with its true cost — so the per-hour number is measured and the payback is proven on dashboards.
Sign up free to build it.
Turn "We Should Do PdM" Into a Number They Sign.
Use this guide plus OxMaint to size the real cost of welding robots & cells downtime, build the ROI on your own cells, and convert line-stopping surprises into planned off-shift part swaps — with payback in weeks, proven on the dashboard. Start free — no credit card, unlimited users, forever.