During a power plant turnaround, the difference between a crew that finishes on schedule and one that quietly slips a shift behind is rarely visible until the daily progress meeting — and by then, the delay has already compounded. Outage managers walking the floor each morning are working from yesterday's information, comparing planned hours against actual output written on whiteboards or read off a contractor's tablet. A crew productivity dashboard changes this by pulling real-time progress, labor hours, and output rates from every contractor team into a single live view, so falling behind becomes visible the moment it starts rather than the next morning. OxMaint's contractor productivity dashboard turns scattered field updates into one screen outage managers can act on.
Outage Analytics & Reporting
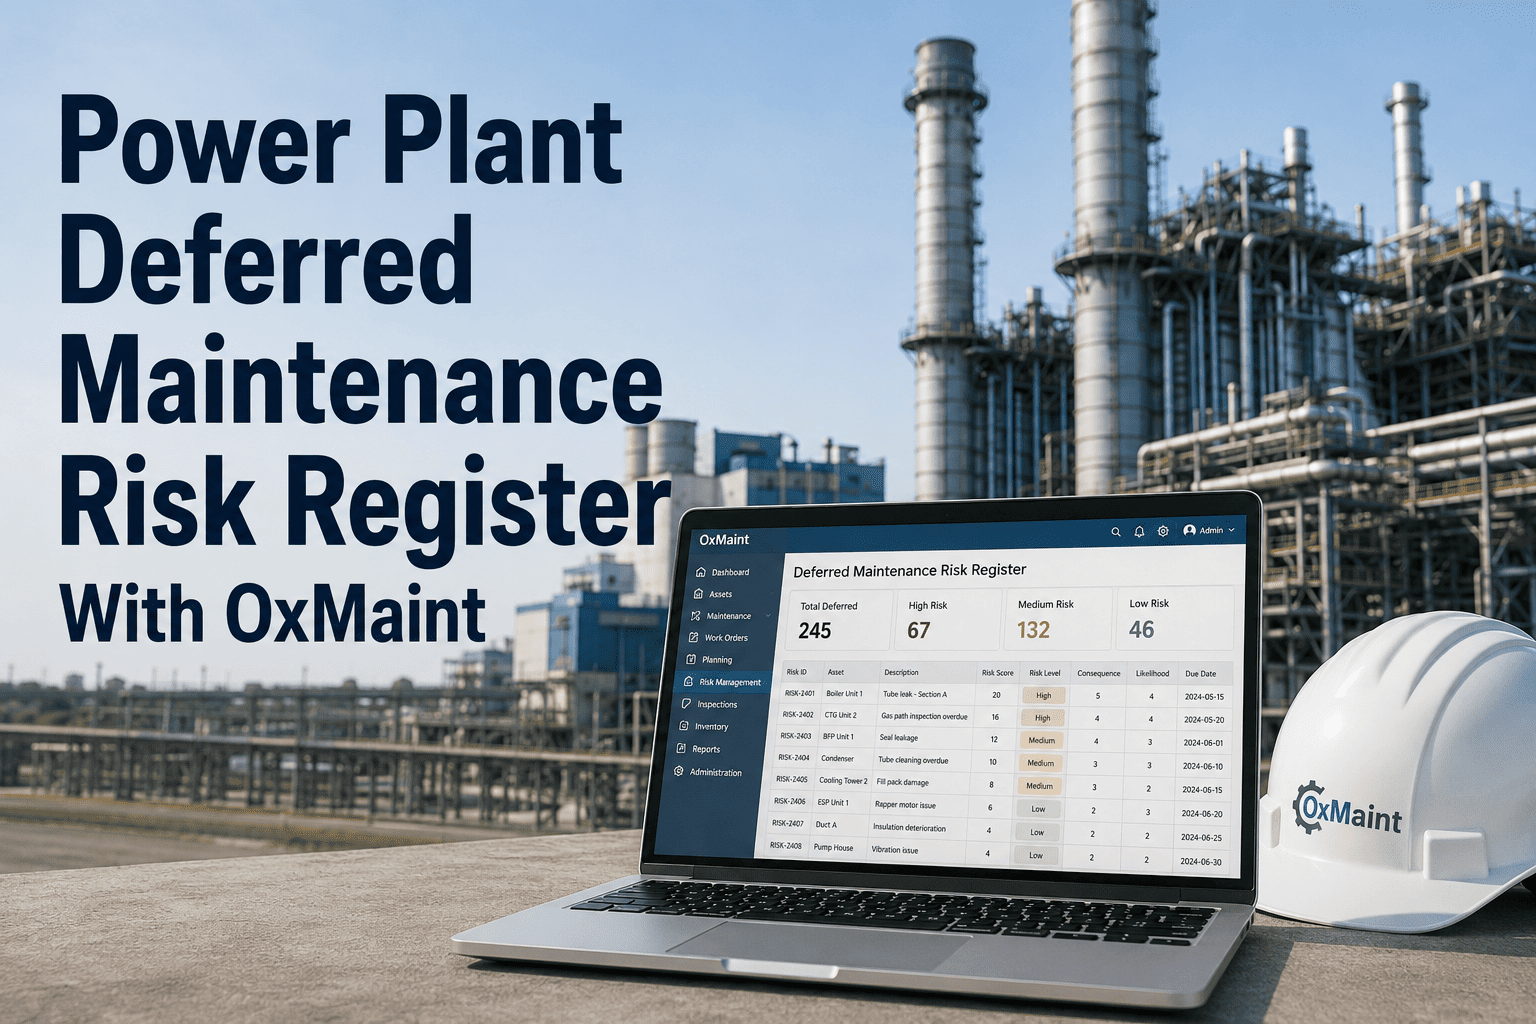
See Every Crew's Progress, Live, Without the Morning Walkdown
A real-time productivity dashboard that compares planned vs actual progress for every contractor crew working your turnaround.
What a Live Crew Dashboard Actually Shows
Instead of a stack of contractor reports at the end of the day, outage managers get a single panel showing planned-versus-actual progress for every crew, updated as field updates come in from mobile devices.
Turnaround Progress — Unit 2 Day 6
Mechanical Crew A — Boiler Tube Replacement
78%
Electrical Crew B — Switchgear Overhaul
54%
Insulation Crew C — Lagging Restoration
92%
Civil Crew D — Foundation Repair
35%
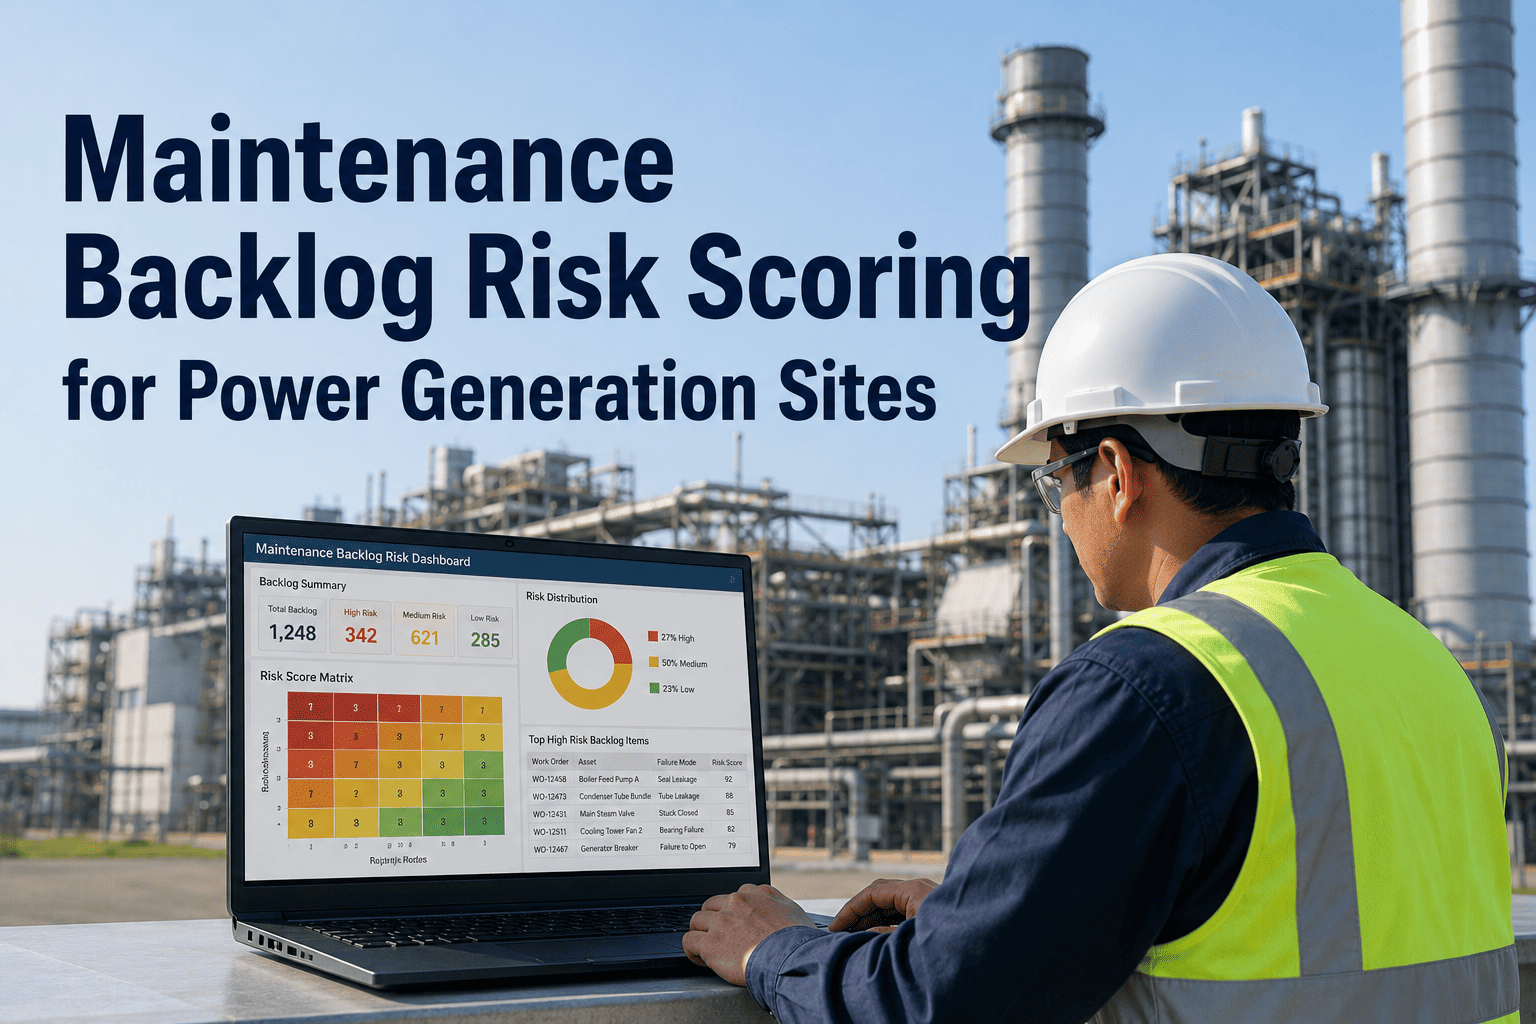
Six Metrics Outage Managers Track Per Crew
Planned vs Actual Progress
Percent complete against the baseline schedule for each work package, updated as field crews log progress.
Earned Labor Hours
Hours actually productive against hours billed, surfacing crews where output does not match logged time.
Idle & Wait Time
Time lost waiting on permits, access, parts, or equipment — broken down by cause and by crew.
Overtime Trend
Daily overtime hours per crew, tracked against the recovery plan to catch cost overruns early.
Manpower on Site
Headcount per crew against the mobilization plan, flagging crews running short-handed.
Critical Path Impact
Which delayed work packages sit on the critical path, so attention goes to the slippage that matters most.
Turn Field Updates Into Decisions Before the Shift Ends
By the time a morning walkdown reveals a delay, recovery is already a shift behind. OxMaint surfaces productivity gaps as they happen, so outage managers can reassign crews or escalate before the critical path moves.
From Daily Reports to Real-Time Signals
Most outages run on a reporting cycle that is always one step behind the work. Replacing that cycle with live signals changes what an outage manager can do about a problem the moment it appears.
Before
Crew progress is reported once per shift, often verbally, with no comparison against the baseline schedule.
Now
Progress updates flow in continuously from mobile devices and are compared against the plan automatically.
Before
A crew falling behind is noticed only when the delay starts affecting the next work front.
Now
A crew tracking below planned progress is flagged on the dashboard the same day, with the cause attached.
Before
Overtime and idle time are reconciled at the end of the outage, when there is no opportunity to correct course.
Now
Overtime trends and idle time causes are visible daily, giving outage managers time to adjust crew plans.
Frequently Asked Questions
Where does the data on a contractor productivity dashboard come from?
Progress, hours, and status updates are entered by contractor crews through mobile devices as work is completed, feeding directly into the dashboard.
OxMaint compares these updates against the baseline schedule automatically, without requiring a separate reporting step.
Can the dashboard show which delays are affecting the overall outage schedule?
Yes — each work package is linked to the outage schedule, so a delay on a critical path item is highlighted differently from a delay on a work front with float remaining. This lets outage managers prioritize attention by actual schedule impact.
Does the dashboard track contractor labor hours for billing purposes?
The dashboard shows earned hours against logged hours per crew, which gives outage managers visibility into productivity trends. It is intended for progress tracking and is typically used alongside the contractor's own timekeeping system.
How quickly is a crew falling behind schedule flagged on the dashboard?
As field updates come in throughout the shift, the dashboard recalculates planned-versus-actual progress and flags any crew tracking below the baseline curve the same day.
Book a demo to see how flags appear during an active outage.
Can multiple contractor companies use the same dashboard during one turnaround?
Yes — each contractor crew sees only their assigned work packages and progress, while outage managers see the consolidated view across every crew on site. This keeps reporting simple for contractors while giving planners the full picture.
Give Your Next Turnaround a Live Progress View
Replace end-of-shift reporting with a dashboard that shows every crew's progress, hours, and risk in real time. Start a free trial or book a 30-minute walkthrough with the OxMaint team.