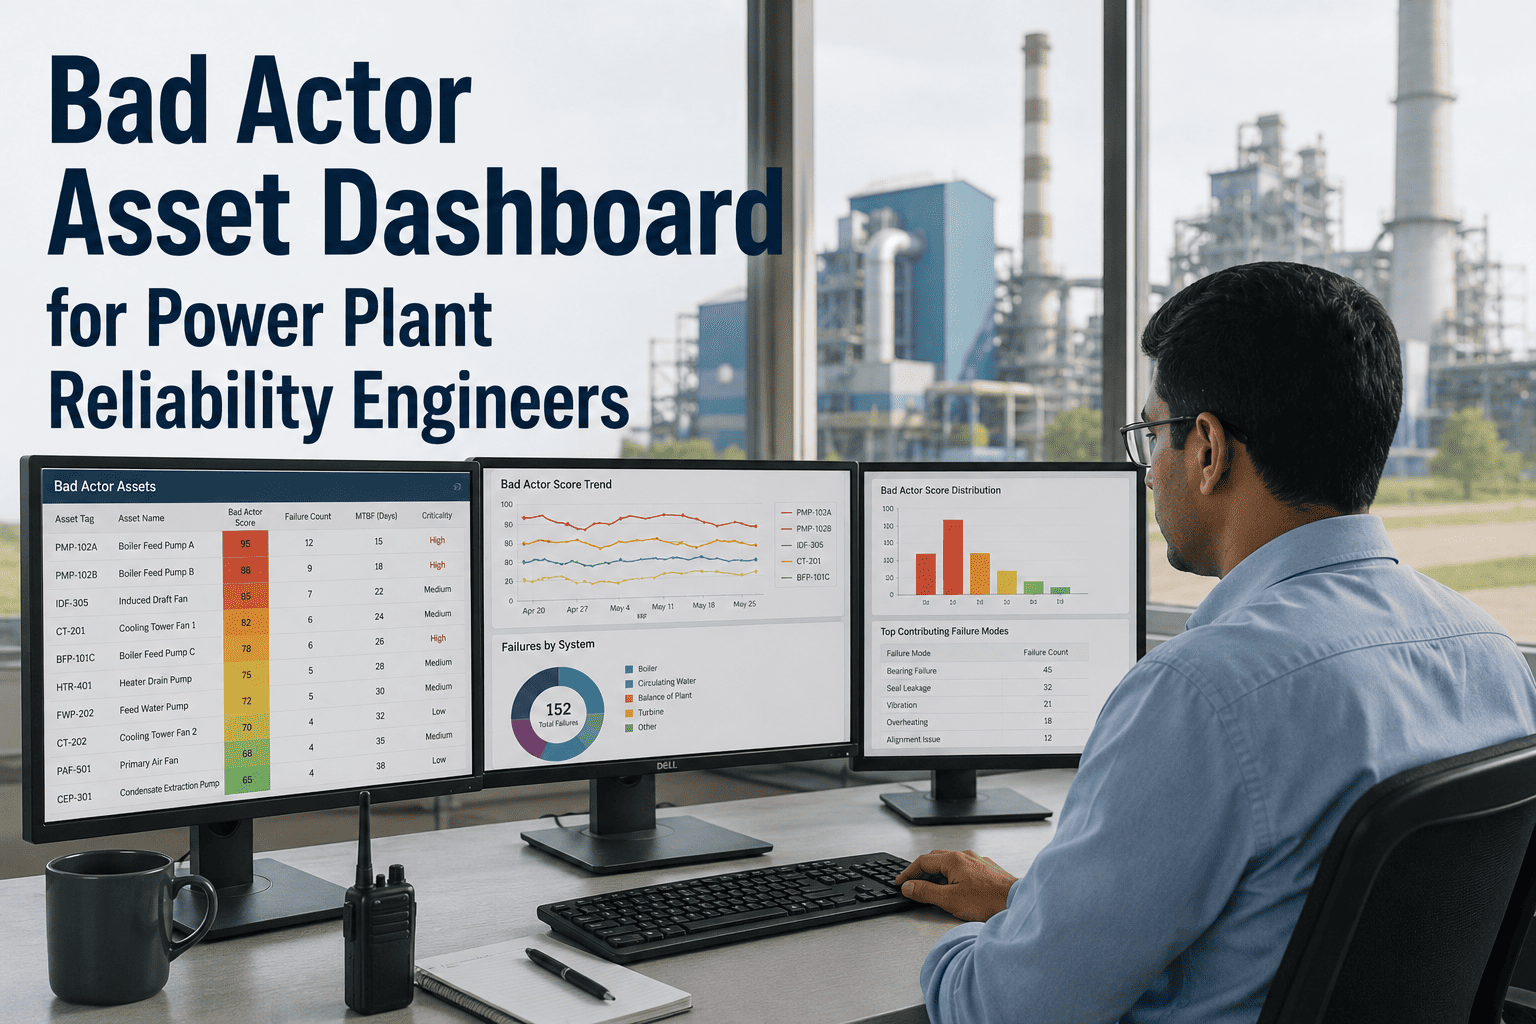
Every plant has at least one asset that everyone on the maintenance team knows by name — the boiler feed pump, the coal feeder, the cooling water pump that fails every few months no matter how many times it gets repaired. Industry definitions call this a bad actor: an asset with three or more unplanned failures in a rolling two-year window, or two failures in six months. The maintenance team keeps fixing it, the work order closes, and weeks later the same failure mode appears again — because the repair addressed the symptom, not the condition that caused it. Breaking this cycle requires a structured workflow that ranks failures by cost, runs root cause analysis on the worst offenders, and tracks whether the fix actually held. OxMaint's reliability workflow ranks bad actors automatically from work order history and routes them into that process.
Asset Performance Management
Stop Repairing the Same Failure Every Quarter
A repeat failure elimination workflow that ranks bad actors by cost, drives RCA on the worst offenders, and verifies the fix actually worked.
The Repeat Failure Cycle Most Plants Are Stuck In
Without a structured elimination process, maintenance teams stay locked in the same loop: a bad actor fails, gets repaired under pressure, and runs until it fails again — while the underlying condition is never addressed.
1
Asset fails unexpectedly, disrupting production
→
2
Team firefights a repair to restore operation fast
→
3
Work order closes — no RCA on the failure mode
↩
4
Same asset fails again within months, cycle repeats
The Six-Step Elimination Workflow
1
Capture Failure Data
Every failure is logged against the asset with failure mode, cost, and downtime — at the work order, not in a spreadsheet afterward.
2
Rank Bad Actors
A Pareto ranking surfaces the small number of assets driving the majority of unplanned cost and downtime.
3
Run RCA on Top Offenders
The worst-ranked assets get a structured root cause investigation, not just another repair.
4
Engineer a Permanent Fix
The corrective action addresses the systemic cause — lubrication strategy, PM task content, or installation procedure — not just the failed part.
5
Track MTBF After the Fix
Mean time between failures on the asset is monitored after the fix to confirm the failure mode has actually stopped.
6
Capture the Lesson Learned
The fix and its result are recorded so sister units and future PM strategies benefit from the same finding.
Find Your Bad Actors Without a Spreadsheet
Ranking bad actors manually means pulling work order history every quarter and reconciling it by hand. OxMaint ranks assets automatically from live work order data, so the worst offenders are always visible.
What a Bad Actor Ranking Looks Like
A small number of assets typically drive most of the cost of unreliability. Ranking by total cost — repair plus lost generation — shows reliability teams exactly where to focus first.
1
Boiler Feed Pump 2 — 4 failures in 18 months
$2.01M
2
ID Fan A — 3 bearing failures in 2 years
$1.42M
3
Cooling Water Pump 1 — repeated seal failures
$0.96M
4
Coal Feeder 3 — 3 trips in 6 months
$0.64M
5
Instrument Air Compressor — recurring overheating
$0.41M
Symptom Swapping vs the Elimination Workflow
Symptom Swapping
Same part replaced repeatedly with no investigation
PM task remains generic — "inspect pump" — regardless of failure mode
No cost ranking — every asset gets equal attention
No verification that a repair actually held
Elimination Workflow
Failure mode investigated and traced to a systemic cause
PM tasks updated with specific checks tied to the actual failure mode
Bad actors ranked by total cost of unreliability, attention prioritized
MTBF tracked after the fix to confirm the failure mode is gone
Frequently Asked Questions
What qualifies an asset as a "bad actor"?
Common definitions are three or more unplanned failures within a rolling two-year window, or two failures within six months on the repeat-offender watchlist.
OxMaint lets plants tune these thresholds to their own asset count and data history.
How is a bad actor ranking calculated?
Each asset's repair cost and lost generation cost from unplanned failures are totaled over a defined period, producing a Pareto ranking that shows which assets drive the most cost — typically a small fraction of the asset list.
Who should own the repeat failure elimination program?
Reliability engineering typically owns the analysis and RCA work, while maintenance focuses on day-to-day repairs — with the CMMS acting as the shared data source between the two teams.
Book a demo to see how both teams use the same ranking.
How long does it take to see results from a bad actor program?
Plants typically see measurable reduction in repeat failures on the top-ranked assets within a few maintenance cycles after the permanent fix is implemented and verified, though full program maturity takes longer.
What happens if a new bad actor appears after the current list is eliminated?
Bad actor rankings should be reviewed on a recurring basis, since eliminating today's worst offenders often shifts attention to the next tier of assets. Continuous ranking from live work order data keeps the list current automatically.
Turn Your Worst Assets Into Your Most Reliable
OxMaint ranks bad actors from live work order history, routes them into RCA, and tracks MTBF after every fix — so repeat failures actually stop repeating. Start a free trial or book a 30-minute walkthrough.