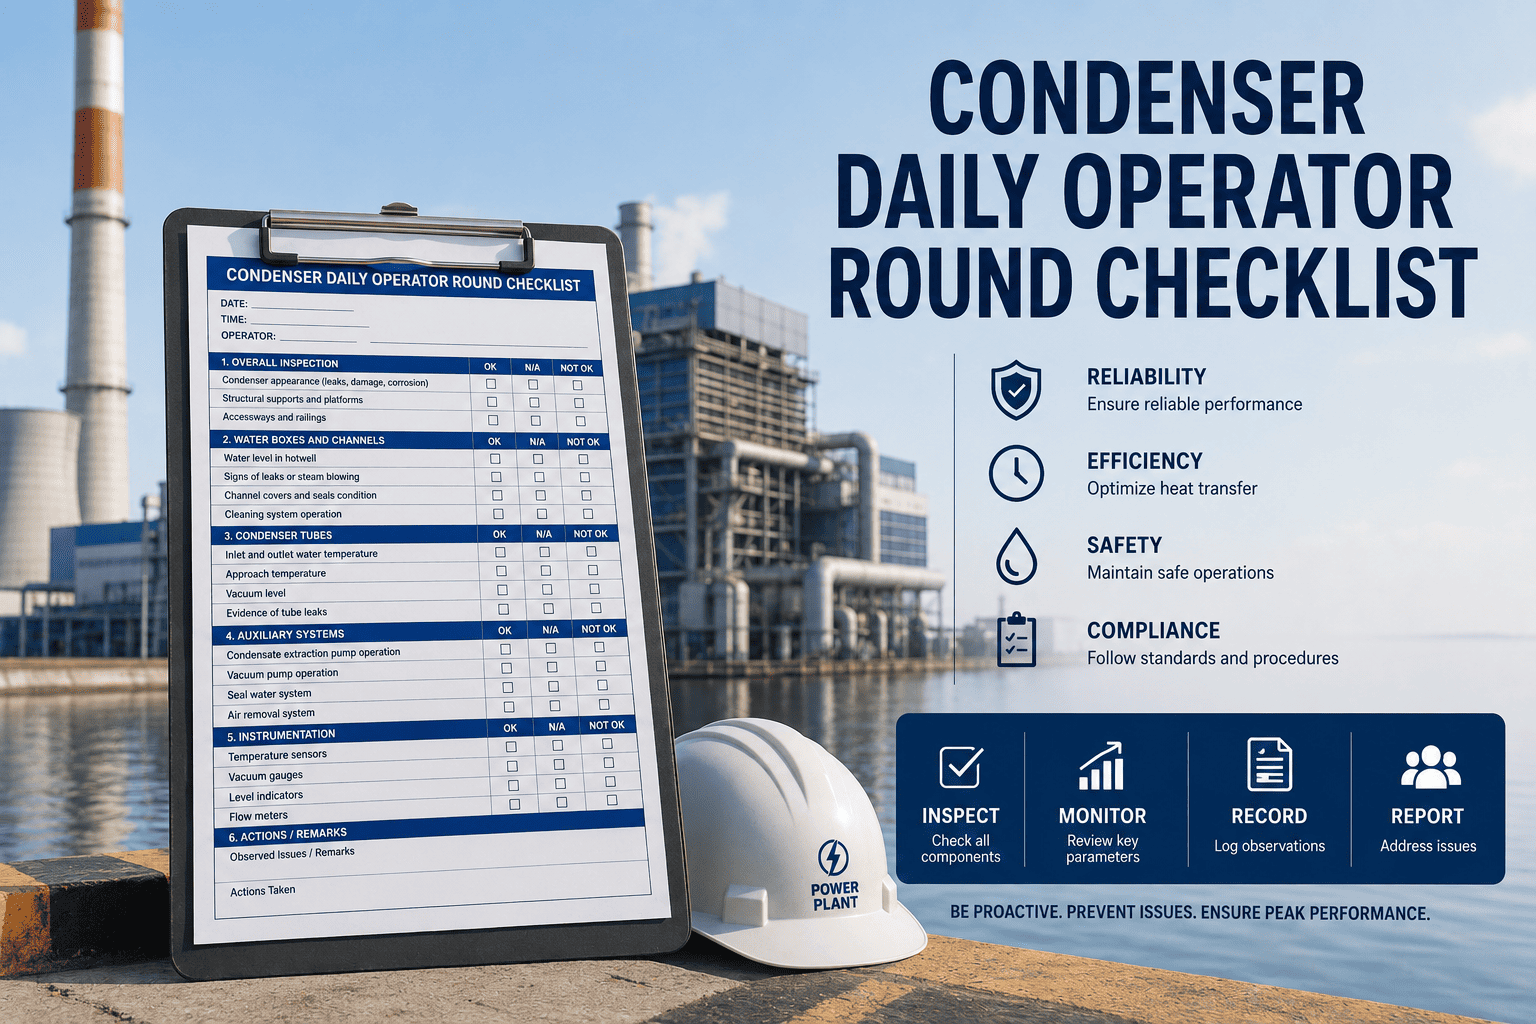
A condenser daily operator round is the frontline defence against turbine backpressure creep, fouling losses, and unplanned shutdowns. Every degree of terminal temperature difference (TTD) left unchecked compounds into megawatt losses and accelerated tube degradation — losses that structured daily rounds catch before they become maintenance events. The condenser connects the steam cycle to ambient conditions, and ambient conditions change every shift. That makes the daily round not a formality but a performance management activity: you are measuring the gap between the condenser your plant was designed around and the condenser operating right now. Oxmaint digitises every parameter in this checklist into a guided operator workflow with auto-timestamped records and instant CMMS work order generation — so findings never get lost between shifts.
Run Condenser Rounds on Oxmaint
Oxmaint gives operators and maintenance engineers a single platform to complete condenser daily rounds digitally, track backpressure trends across shifts, flag cleanliness factor drops automatically, and generate corrective work orders before efficiency losses compound.
What the Daily Round Actually Measures
The condenser daily round is not a visual walk-around — it is a quantitative performance snapshot. Each parameter has a design baseline, a current reading, and a delta that tells the operator whether the condenser is degrading, stable, or improving. Operators who understand why each parameter matters catch abnormalities that operators who only record numbers will miss. The five core measurement areas are backpressure, cleanliness factor, cooling water temperatures, air ejector performance, and hotwell level and chemistry.
1. Backpressure and Vacuum Check
Backpressure is the single most important condenser performance indicator because it directly affects turbine output. A condenser operating 1 inHg above its design point at rated load typically costs 1–2 MW of output on a 100 MW unit — losses that accumulate shift after shift and never appear on a single inspection report without trend data. Track backpressure trends across every shift with Oxmaint's condenser performance dashboard.
Turbine exhaust pressure — compare to design curve at current load
Read condenser pressure from the main plant DCS or local gauge. Calculate expected design pressure from the condenser performance curve at current CW inlet temperature and turbine load. Record the delta. A delta greater than 0.3 inHg above design at stable load warrants investigation before the next round. Action — delta over 0.3 inHg
Vacuum reading — absolute and gauge, both instruments cross-checked
Compare the mercury manometer or electronic vacuum transmitter reading against the DCS value. A 0.1 inHg discrepancy between instruments indicates an instrument calibration drift that masks true backpressure performance. Record both values — never rely on a single instrument for backpressure decisions. Record — both instruments
Backpressure alarm setpoints — verify active and correct for season
Alarm setpoints should be seasonally adjusted to reflect design curves at current ambient temperatures. A summer alarm threshold left at a winter value will not alert operators to genuinely abnormal performance. Verify the high-backpressure alarm is set within 0.5 inHg of the corrected design value for current conditions. Verify — seasonal setpoint
Saturation temperature — cross-check against steam tables at measured pressure
Calculate saturation temperature from the measured condenser pressure using steam tables. Compare to the measured condensate temperature leaving the hotwell. A condensate temperature more than 2°F below saturation temperature at the same pressure indicates subcooling — a dissolved oxygen risk that requires investigation. Alert — subcooling detected
2. Cleanliness Factor and Heat Transfer Check
Cleanliness factor (CF) is the ratio of actual heat transfer to theoretical clean-tube heat transfer. It starts at 0.85–0.95 after a tube cleaning and degrades continuously as biological fouling, silt, and scale accumulate. Most plants target CF above 0.85 as the trigger for cleaning — but without daily measurement, cleaning is scheduled by calendar rather than by actual tube condition, and calendar-based cleaning almost always happens too late.
Calculate cleanliness factor — actual vs theoretical U value
Calculate actual overall heat transfer coefficient (U) from current CW flow, temperature rise, and condenser surface area. Divide by the design clean-tube U value at the same conditions. Record the result. A CF below 0.85 requires a cleaning work order. A CF drop of more than 0.03 in a single day indicates aggressive fouling that warrants immediate investigation. Work order — CF below 0.85
Terminal temperature difference — trend against 30-day moving average
TTD is the difference between condenser saturation temperature and cooling water outlet temperature. Record today's TTD and compare to the 30-day average. An increasing TTD trend at stable CW inlet temperature is a direct fouling signature — cleanliness factor calculation will confirm. Rising TTD without CW inlet temperature change is never normal and always requires investigation. Trend — rising TTD
Tube fouling visual check — accessible waterboxes and inlet screens
Inspect CW inlet screens for debris accumulation that restricts flow. Check accessible waterbox drain ports for biological material or silt. Any screen blockage above 25% of screen area causes a CW flow restriction that elevates backpressure independently of tube fouling — it must be cleared and logged as a separate finding from CF degradation. Clear — screen blockage
3. Cooling Water System Check
Cooling water temperature and flow are the environmental inputs that define what the condenser can achieve. Accurate CW data separates degradation from normal seasonal variation — a condenser running hotter because CW inlet rose 5°F is performing correctly; the same backpressure increase with stable CW inlet means the condenser itself has degraded. Log CW temperature data automatically from field sensors into Oxmaint's condenser health record.
CW inlet temperature — both passes if two-pass condenser
Record CW inlet temperature at the condenser inlet flange, not at the cooling tower basin — temperature rise in the inlet piping adds to effective condenser load and must be accounted for in performance calculations. On two-pass condensers, record both pass inlet temperatures and verify balance within 1°F. Record — both passes
CW outlet temperature — temperature rise calculation
Record CW outlet temperature and calculate temperature rise (ΔT). Compare to design ΔT at current turbine load. A lower-than-design ΔT at normal CW flow indicates reduced heat rejection — consistent with reduced turbine load or a tube bypass. A higher-than-design ΔT at normal flow indicates reduced CW flow — check CW pump performance. Investigate — ΔT deviation
CW pump — discharge pressure, amps, and vibration
Record CW pump discharge pressure and motor current. Compare to baseline values at the same CW system configuration. A rising motor current at constant discharge pressure indicates impeller wear or cavitation. Any vibration increase above 0.1 in/s above baseline at bearing housings requires a maintenance notification before the next round. Notify — vibration increase
Cooling tower performance — approach temperature
For plants with cooling towers, record cold basin temperature and ambient wet bulb temperature. Calculate cooling tower approach (basin temp minus wet bulb). An approach greater than 5°F above design indicates cooling tower degradation that limits condenser performance regardless of condenser condition — tower performance and condenser performance are interdependent. Record — tower approach
4. Air Ejector and Vacuum System Check
Air in-leakage is the most common cause of backpressure exceedance in steam condensers — responsible for over half of all condenser performance events in thermal power plants. Non-condensable gases accumulate in the steam space, blanket tube surfaces, and reduce effective heat transfer area. The air ejector's job is to continuously remove these gases; when the ejector load rises above its normal range, the system is telling you that air is entering faster than normal.
Air ejector steam flow — compare to baseline at current backpressure
Record primary and secondary ejector steam flow. Compare to the commissioning baseline at the current condenser pressure. An ejector steam flow more than 15% above baseline at the same backpressure indicates an elevated non-condensable load — either increased air in-leakage or a process-side source of non-condensables. Investigate — flow above baseline
Air ejector discharge — verify to hotwell or atmosphere per design
Confirm the air ejector is discharging correctly per plant design — either to the hotwell inter-condenser or to atmosphere through the vent. A continuous audible discharge to atmosphere during normal operation is acceptable on the second-stage ejector. Intermittent discharge from a stage that should be continuous indicates lost vacuum on that ejector stage. Alert — lost stage vacuum
Dissolved oxygen in condensate — cross-check with air ejector load
Record condensate dissolved oxygen from the online analyser at the condensate pump discharge. Normal DO is below 7 ppb on an operating plant. DO above 20 ppb with elevated air ejector load confirms air in-leakage. DO above 20 ppb with normal ejector load indicates a chemical source of oxygen — requires chemistry investigation independent of the air leak search. Alert — DO above 20 ppb
Vacuum pump or hogging ejector — available and lined up correctly
Verify the hogging ejector or vacuum pump is in its correct standby or service alignment per plant procedures. A hogging ejector inadvertently left in service during normal operation adds unnecessary steam consumption and can suppress the normal ejector's performance indicators that detect air in-leakage. Verify — standby alignment
5. Hotwell and Condensate Quality Check
The hotwell is the interface between the condenser and the feedwater cycle. Hotwell level control prevents both condensate pump cavitation and tube submersion. Condensate chemistry at the hotwell is the earliest detectable signal for condenser tube leaks, air in-leakage, and cooling water contamination — all three of which can cause boiler chemistry upsets that force load reductions or shutdowns if not caught at the condenser.
Hotwell level — normal band, LCV position, and makeup trend
Record hotwell level and compare to the normal operating band (typically 50–70% of level gauge). Check the level control valve position — a LCV in fully-open position maintaining a falling level indicates a condensate loss path. A LCV in fully-closed position with rising level indicates excess condensate return or a valve that is not responding to level demand. Investigate — LCV fully open or closed
Condensate pH — record and trend against limits
Record condensate pH from the on-line analyser. Normal pH with ammonia treatment is 8.8–9.2. A pH drop below 8.5 with no change in ammonia dosing rate indicates CO2 ingress — consistent with air in-leakage introducing carbonic acid. A pH drop with increased CW system chloride levels indicates condenser tube leak — requires immediate tube leak investigation. Alert — pH drop below 8.5
Condensate conductivity — tube leak indicator
Record condensate cation conductivity (after cation exchange column). Values above 0.2 µS/cm are the primary indicator of cooling water contamination through a tube leak. Any cation conductivity spike, even briefly, requires immediate tube leak investigation and notification to chemistry. Continued operation with a confirmed tube leak risks boiler tube deposit-induced failures. Alert — cation cond. above 0.2 µS/cm
Performance Benchmarks — What Good Looks Like
These benchmarks represent industry-standard targets for well-maintained condensers in thermal power plants. Individual plant design curves take precedence — these figures are starting points for operators who do not yet have plant-specific baselines established.
| Parameter | Target Range | Action Threshold | Trip / Emergency |
|---|---|---|---|
| Backpressure delta vs design | 0 to +0.2 inHg | +0.3 inHg — investigate | +0.8 inHg — load reduction |
| Cleanliness factor | 0.88 – 1.00 | Below 0.85 — schedule cleaning | Below 0.75 — emergency clean |
| TTD above design | 0 to 2°F | 3°F — cleaning review | 6°F — immediate action |
| Dissolved oxygen | Below 7 ppb | Above 20 ppb — air leak search | Above 100 ppb — report to chemistry |
| Cation conductivity | Below 0.15 µS/cm | 0.2 µS/cm — tube leak investigation | 1.0 µS/cm — load reduction |
| Condensate pH | 8.8 – 9.2 | Below 8.5 — CO2 or leak check | Below 8.0 — chemistry shutdown criterion |
Frequently Asked Questions
Replace Paper Condenser Rounds with Digital Records
Oxmaint structures every condenser daily round parameter into a guided digital form — auto-calculating cleanliness factor, flagging threshold exceedances, and generating work orders in real time. No more lost round sheets. No more missed trends between shifts.