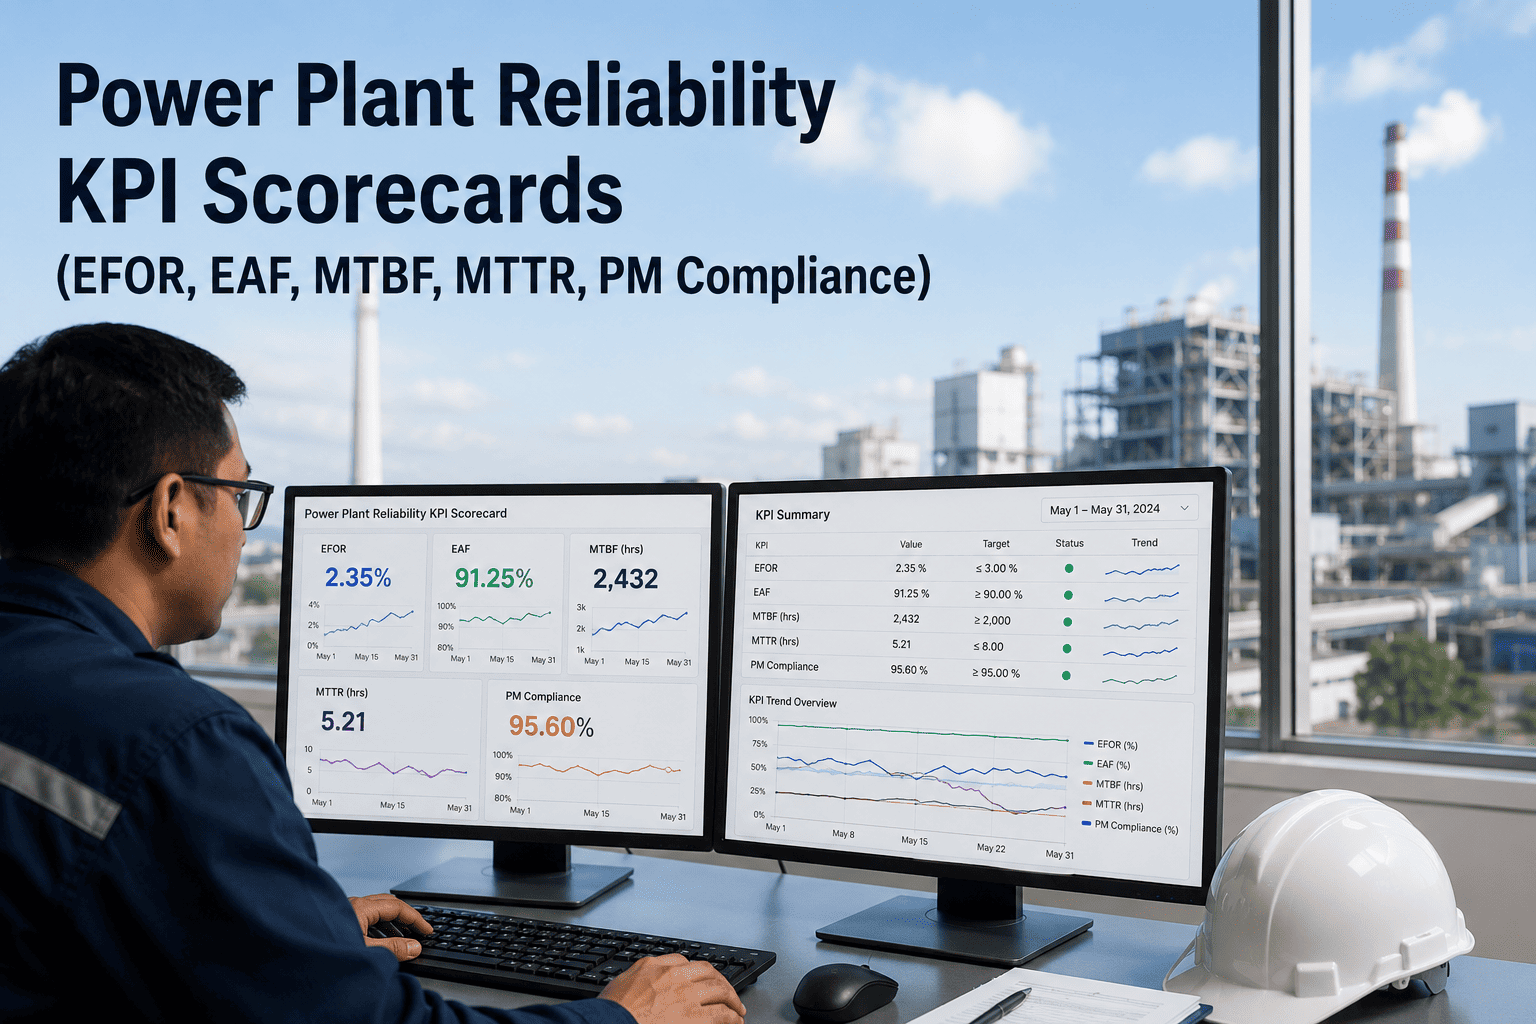
Most power plant reliability teams are tracking the wrong numbers — or worse, the right numbers in the wrong way. A turbine that shows 98% availability on a monthly PDF might have an MTBF trend that's been declining for six consecutive weeks, and nobody sees it until the forced outage happens. This scorecard template brings together the six KPIs that actually drive generation reliability — EFOR, EAF, MTBF, MTTR, PM Compliance, and OEE — into one structured framework that plant engineers, reliability managers, and plant directors can use starting today. Whether you're tracking on spreadsheets now or moving to a live CMMS dashboard, this template shows you exactly what to measure, how to calculate it, and what "good" looks like for your generation type. Start your free Oxmaint trial to get these KPIs calculated automatically, or book a 30-minute session to see a live reliability dashboard built for your plant.
Free Template + Industry Benchmarks
Power Plant Reliability KPI Scorecard
EFOR · EAF · MTBF · MTTR · PM Compliance · OEE — with formulas, benchmarks, and scoring thresholds for every generation type
Thermal
Gas Turbine
Hydro
Wind
Solar
Nuclear
42%
of power plant failures are unplanned — tracked against EFOR benchmarks
81 min
average MTTR in 2024 — up 65% from 2019 industry baseline
56%
of facilities track PM compliance as their primary reliability metric
34%
of OEE losses stem directly from unplanned downtime — the largest single category
The 6 KPIs Every Power Plant Reliability Scorecard Must Include
These are not vanity metrics. Each one maps directly to a decision — when to schedule maintenance, when to escalate, when to replace. Here is what each KPI measures, how to calculate it, and the threshold that separates a reliable plant from one heading toward a forced outage.
EFOR is the primary NERC-standard measure of forced outage performance. It captures both full outages and derated operation — so a turbine running at 60% capacity during a hot section event shows up in your EFOR, not just a full trip.
EAF gives leadership the clearest picture of how much generation capacity was actually available versus the nameplate ceiling. A plant with 95% EAF is a plant your grid operator can count on. Plants below 85% are typically where capacity penalties and contract exposure begin.
MTBF is a leading indicator when trended over time. A boiler feed pump dropping from 1,200 hours MTBF to 800 hours over three consecutive periods is telling you to schedule maintenance now — before it tells you with an unplanned shutdown. Track MTBF per asset, not per plant-wide average.
When MTTR grows beyond 10 hours, it almost always signals a parts availability problem — not a technician capability problem. Track MTTR alongside parts stockout rate. The 2024 industry average climbed to 81 minutes for routine repairs — but major forced outages regularly exceed 48 hours where spare parts aren't pre-staged.
PM compliance is the most actionable metric on this scorecard. If your rate is below 90%, fix it before looking at any other KPI — because MTBF and EFOR will not improve while PMs are slipping. Below 70% means you are in a firefighting loop: reactive repairs consume the time that should be going to scheduled maintenance.
OEE connects your maintenance KPIs to financial output. Every percentage point of OEE improvement at a 500 MW plant equals roughly $2–4M in annual generation revenue recovered. For power generation, Availability is the dominant OEE lever — and MTBF and MTTR are the inputs that move it.
Stop Calculating KPIs in Spreadsheets
Oxmaint computes EFOR, EAF, MTBF, MTTR, PM Compliance, and OEE automatically from your work order and asset data — updated every time a technician closes a job in the field. No monthly calculation sprint. No stale numbers.
Scorecard Template: Tracking Sheet Structure
Use this structure as your monthly or quarterly reliability review framework. Each column captures the data point needed to move from a number to an action.
| KPI |
Reporting Period |
This Period Value |
Prior Period |
12-Month Average |
Target / Benchmark |
Status |
Corrective Action |
| EFOR (%) |
Monthly / Quarterly |
Enter % |
Prior % |
Rolling avg |
Below 5% |
On Target |
If above 5%: review forced outage log for top 3 events |
| EAF (%) |
Monthly / Annual |
Enter % |
Prior % |
Rolling avg |
Above 92% |
Monitor |
If below 92%: identify derating events and root cause |
| MTBF (hrs) |
Monthly per asset class |
Enter hrs |
Prior hrs |
Rolling avg |
Upward trend |
On Target |
If declining 3 periods: review PM interval for that asset class |
| MTTR (hrs) |
Monthly per asset class |
Enter hrs |
Prior hrs |
Rolling avg |
Below 4 hrs |
Action |
If above 10 hrs: audit parts availability for top 5 failure modes |
| PM Compliance (%) |
Weekly / Monthly |
Enter % |
Prior % |
Rolling avg |
Above 95% |
Monitor |
If below 90%: identify top 5 overdue assets and assign owner |
| OEE (%) |
Monthly / Quarterly |
Enter % |
Prior % |
Rolling avg |
Above 85% |
On Target |
If below 75%: decompose into Availability, Performance, Quality losses |
KPI Benchmarks by Generation Type
Target thresholds differ significantly by plant type. A gas turbine with 4% EFOR is performing differently than a coal steam unit with the same number. Use these generation-specific benchmarks when setting scorecard targets.
Gas Turbine (Combined Cycle)
EFOR TargetBelow 3%
EAF TargetAbove 94%
Typical MTBF7,000 – 9,000 hrs
PM ComplianceAbove 95%
Borescope intervals at 8,000 hrs are the primary MTBF driver. EFOR often spikes post-outage if return-to-service checks are incomplete.
Coal / Steam Thermal
EFOR TargetBelow 6%
EAF TargetAbove 88%
Typical MTBF4,000 – 6,000 hrs
PM ComplianceAbove 92%
Boiler tube thinning is the top EFOR driver. Statutory inspections and thickness scan records must be current for regulatory compliance alongside KPI tracking.
Hydroelectric
EFOR TargetBelow 2%
EAF TargetAbove 95%
Typical MTBF10,000 – 15,000 hrs
PM ComplianceAbove 96%
Hydro EFOR is among the lowest of any generation type. When it rises, root cause is almost always cavitation or runner erosion that was not caught in condition monitoring.
Wind (Onshore)
EFOR TargetBelow 4%
EAF TargetAbove 97%
Typical MTBF2,000 – 3,500 hrs (gearbox)
PM ComplianceAbove 94%
Gearbox failure is the dominant MTBF driver for onshore wind. OEM-specified lubrication and vibration monitoring intervals are the minimum PM compliance standard.
How to Use This Scorecard in Your Plant Review Cadence
A scorecard only creates value if it connects a number to a decision. Here is the review cadence that high-reliability plants follow — and the question each review must answer.
Weekly
PM Compliance Check
Review overdue work orders by asset criticality tier. Any critical asset with a missed PM triggers an immediate rescheduling conversation — not a monthly report footnote.
Key question: Which PMs slipped this week, and why?
Monthly
MTBF and MTTR Trend Review
Compare this month vs. 3-month rolling average per asset class. Declining MTBF over three consecutive months is the trigger to adjust PM intervals or initiate condition-based inspection. Rising MTTR triggers a spare parts audit for that asset's top failure modes.
Key question: Which asset classes are trending in the wrong direction?
Quarterly
EFOR, EAF, and OEE Portfolio Review
Roll up EFOR and EAF by unit and by plant. Decompose OEE into Availability, Performance, and Quality components. Quarterly review identifies systemic patterns — a unit consistently showing elevated EFOR is a capital planning signal, not just a maintenance signal.
Key question: Which unit is carrying the most EFOR risk into next quarter?
Annual
Full Scorecard vs. Benchmark Calibration
Compare your 12-month averages against generation-type benchmarks. Identify which KPIs are above target, which are at risk, and where capital or staffing investment would deliver the highest reliability ROI. This review drives next year's maintenance budget justification.
Key question: Where are we above benchmark, and where are we exposed?
Your Scorecard, Calculated Automatically
Oxmaint tracks all six KPIs in real time — from EFOR to PM compliance — directly from your work order and asset data. No manual formulas, no end-of-month data assembly. Your reliability scorecard is always current.
Common Scorecard Mistakes Power Plants Make
Most reliability tracking programs fail for predictable reasons. These are the four patterns that consistently undermine even well-structured scorecards.
01
Tracking Plant-Wide MTBF Instead of Asset-Class MTBF
A single plant-wide MTBF number masks the asset that is about to fail. A plant with 6,000-hour average MTBF can have one critical pump at 400 hours — and that number never surfaces until the event. Always track MTBF per asset class and per individual critical asset.
02
Measuring PM Compliance Without the Completion Window
A PM completed 45 days after its scheduled date still shows as "completed" in most systems — but it counts as missed for compliance purposes. Define your completion window (typically within 10% of the interval) and enforce it in your reporting logic.
03
Using Monthly Reports When Weekly Data Is Available
Monthly KPI reports reflect what the plant looked like 30 days ago. A turbine trending toward failure on week two of the month will complete its failure before the next report cycle. If your CMMS can produce weekly data, your scorecard should use it.
04
Tracking EFOR Without Separating Planned from Forced Events
EFOR measures only forced outages — but when plants lump planned outage hours into their calculations, the metric loses its diagnostic value. Maintain strict separation between Planned Outage Hours and Forced Outage Hours in every work order and every report.
Frequently Asked Questions
QWhat is the difference between EFOR and EAF for power plant reporting?
EFOR measures the probability that a unit will fail during a demand period — it is weighted toward peak hours and forced outage severity. EAF measures total available capacity as a percentage of maximum nameplate capacity over a period. For NERC compliance, EFOR is the standard reportable metric; EAF is more useful for internal reliability trend tracking and capacity planning.
Oxmaint tracks both automatically from work order and outage records.
QHow many months of data do I need before MTBF numbers are meaningful?
You need a minimum of 90 days of consistent work order closure data in your CMMS to establish a baseline MTBF per asset class. After six months, you have enough data to identify trends. Before 90 days, MTBF calculations can be skewed by a single high-profile failure event — use PM compliance as your primary metric until the MTBF baseline is established.
QWhat PM compliance rate should we target before our next NERC audit?
QCan this scorecard template work for a multi-unit or multi-site portfolio?
Yes — add a Unit column and a Site column to the template structure and calculate each KPI at unit level before rolling up to plant and portfolio level. The key is maintaining consistent definitions of "failure event" and "PM completion window" across all units so the numbers are comparable. Portfolio-level EFOR comparison only works if each unit is calculating using identical inputs.
QHow does Oxmaint calculate these KPIs compared to a spreadsheet?
Your Reliability KPIs Should Tell You What to Do Next — Not What Went Wrong Last Month
Oxmaint turns this scorecard into a live dashboard — EFOR, EAF, MTBF, MTTR, PM compliance, and OEE, calculated automatically from your field data and available to every engineer and planner in real time. Deploy across your full asset inventory in under 12 weeks.