A plant with 1,400 registered assets was spending 60% of its preventive maintenance hours on equipment that, if it failed, would cause zero safety risk and under ₹50,000 in production impact — while three genuinely critical assets sat on the same generic monthly PM schedule as everything else. When one of those three failed, the plant lost four days of production because nobody had ever formally ranked it as worth a faster response. Sign up for OxMaint to rank every asset by actual operational risk, not gut feeling.
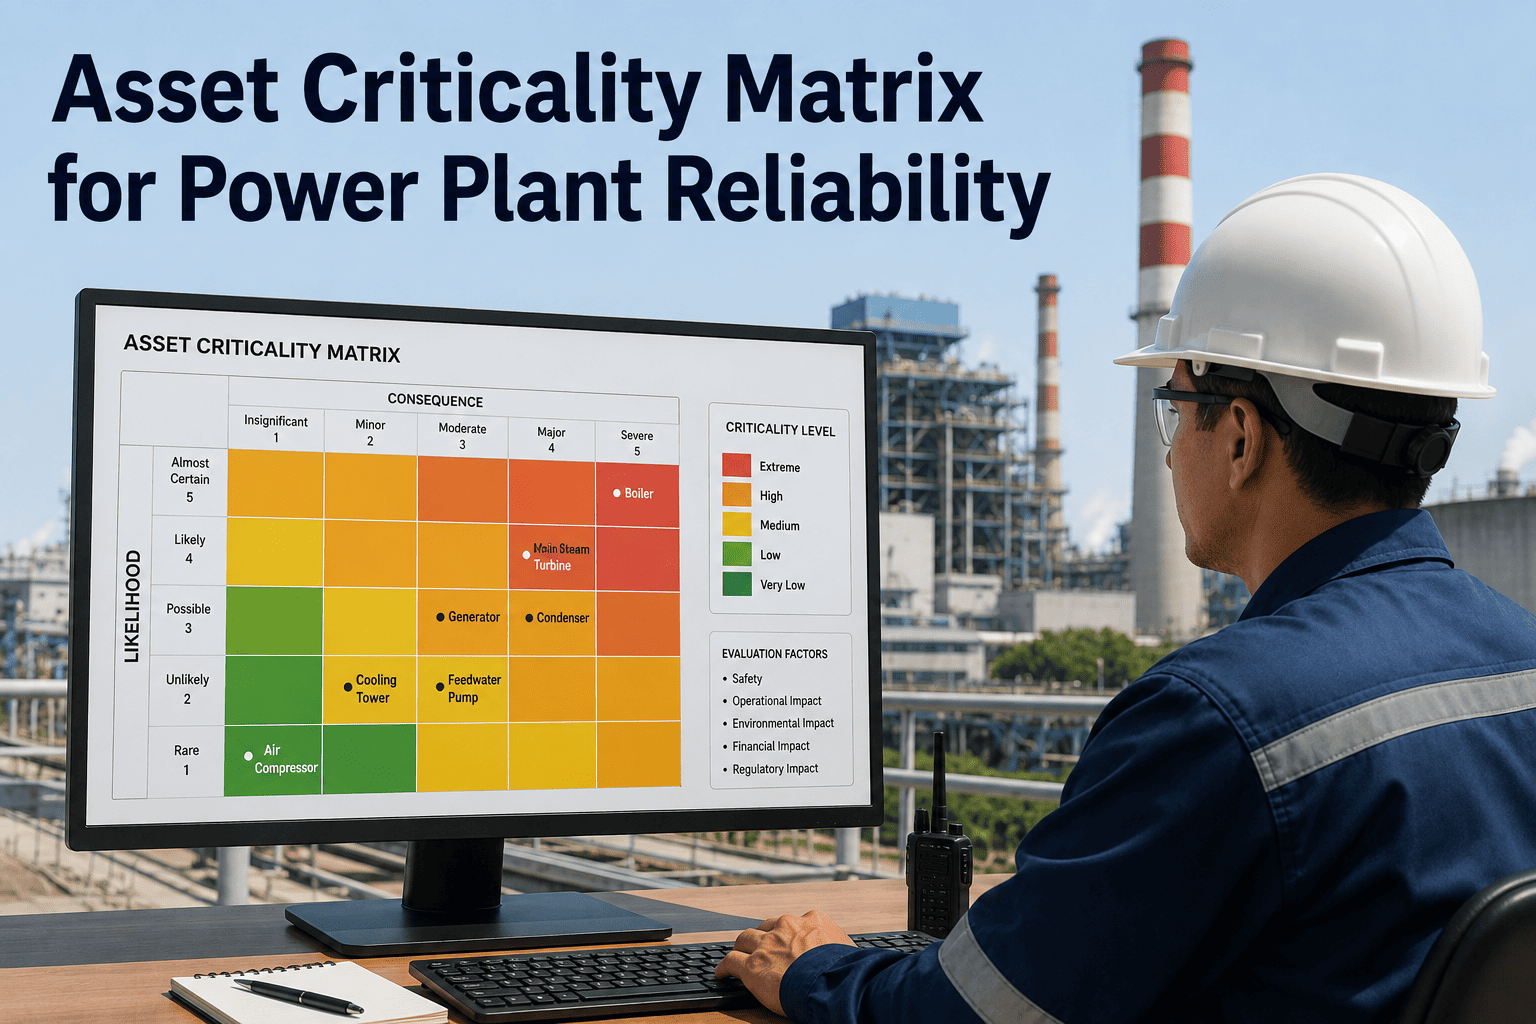
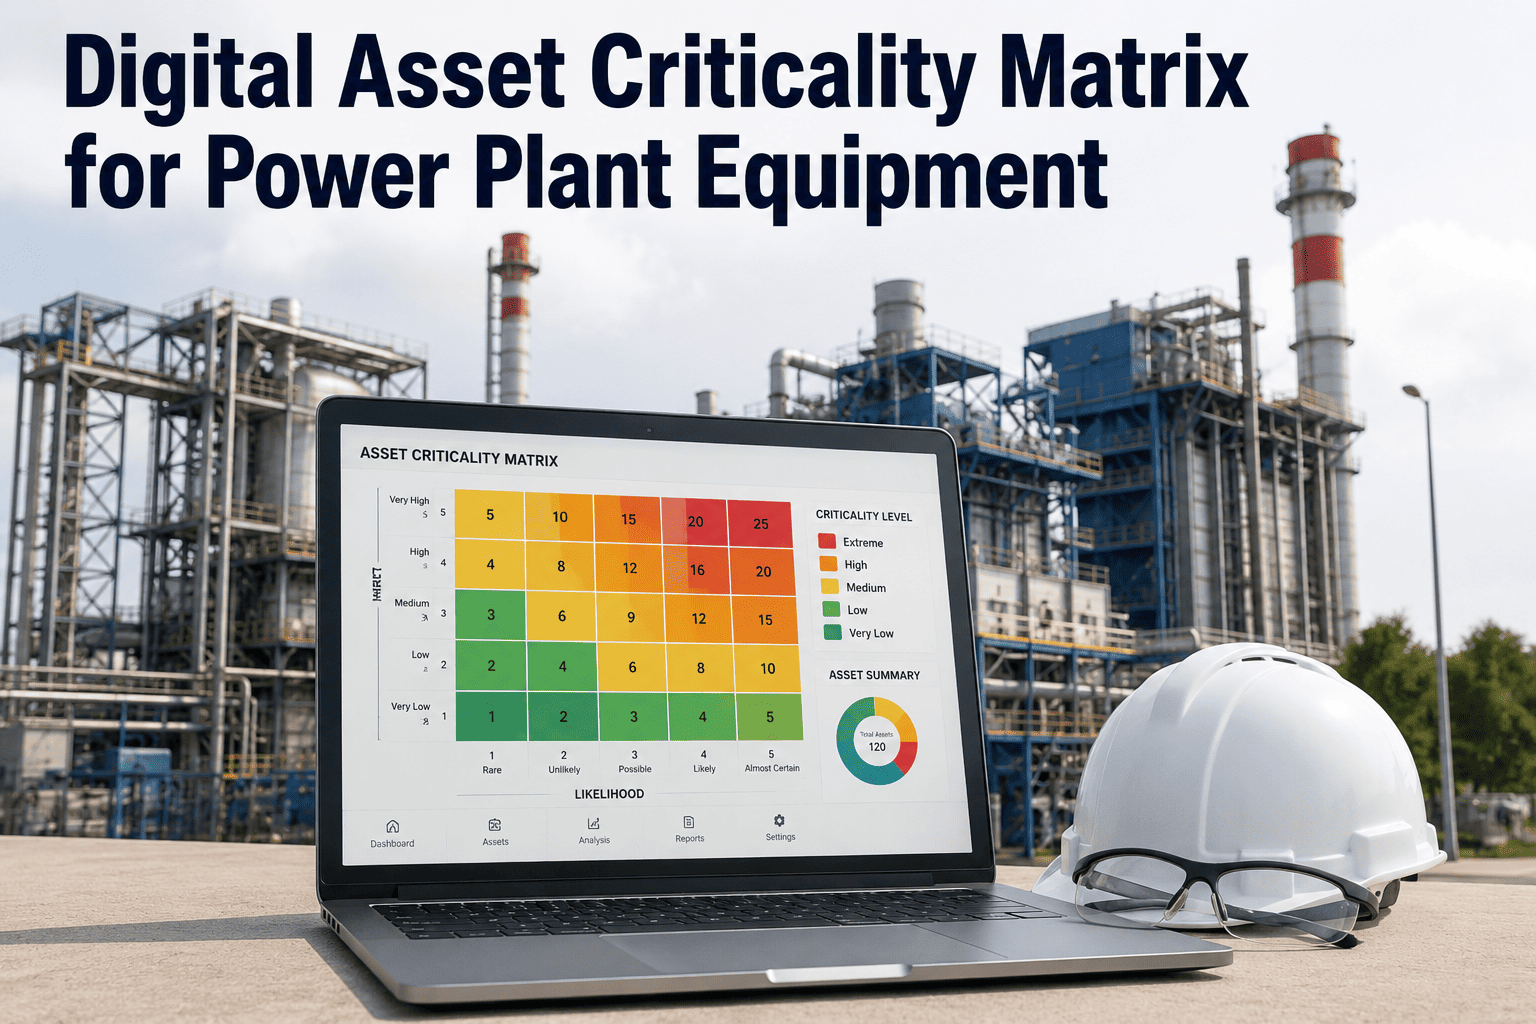
Digital Asset Criticality Matrix for Power Plant Equipment
Rank every asset by safety risk, production impact, and maintenance cost using a structured criticality matrix — then let that ranking drive PM frequency, spare parts stocking, and response priority automatically, instead of treating every asset the same.
When Every Asset Gets the Same Maintenance Attention, the Wrong Ones Get Too Little
Most plants without a formal criticality system default to one of two extremes: an identical PM schedule applied to every asset regardless of consequence, or maintenance prioritization driven by whoever shouts loudest in the morning meeting. Both approaches misallocate scarce maintenance hours.
A boiler feed pump with no installed spare gets the same monthly inspection as a non-essential auxiliary fan, even though its failure would force a unit trip within minutes.
Technician hours spent on detailed monthly inspections of equipment with full redundancy and negligible failure consequence — time that could go toward genuinely critical assets instead.
Without a criticality ranking tied to spares strategy, plants either overstock low-risk components or get caught without a spare for the one asset that actually needed one in stock.
When a breakdown is reported, the response priority depends on who is in the control room that shift rather than a documented, defensible ranking everyone follows the same way.
How OxMaint Builds a Criticality Score for Every Asset
Each asset is scored on the potential for injury, environmental release, or regulatory violation if it fails — the single highest-weighted factor in the overall criticality score.
Assets are scored on whether failure stops production entirely, partially derates output, or has no impact due to installed redundancy — directly tying criticality to actual operational consequence.
Assets that are expensive or slow to repair score higher, since the financial and downtime exposure from a failure compounds the operational risk beyond the immediate production loss.
OxMaint factors in actual historical failure rate logged in the CMMS, so an asset with a track record of frequent breakdowns is weighted higher than its theoretical risk profile alone would suggest.
Assets dependent on long-lead or single-source spare parts are scored higher, reflecting the extended downtime risk if a failure occurs without inventory already on hand.
Turn 1,000+ Assets Into a Ranked, Defensible Priority List
OxMaint's onboarding team works with your reliability and operations leads to score your asset register against these five factors, generating a complete criticality matrix typically within two weeks for a mid-size plant.
Criticality Tier, PM Strategy, and Response Priority
| Tier | Example Assets | PM Strategy | Breakdown Response |
|---|---|---|---|
| Tier A — Critical | Boiler feed pump, main transformer, ID fan | Condition-based + frequent PM | Immediate, all-hands response |
| Tier B — Important | Auxiliary cooling pump, conveyor motor | Scheduled PM, monitored trend | Same-shift response |
| Tier C — Standard | Redundant auxiliary fans, non-critical lighting | Standard interval PM | Next available work order |
| Tier D — Run-to-Failure | Low-cost, fully redundant minor components | Reactive maintenance only | Routine queue, no escalation |
What a Structured Criticality Ranking Does to Maintenance Outcomes
Plants that move from an undifferentiated PM schedule to a tiered criticality system consistently see the same pattern of improvement, because maintenance effort finally matches actual operational risk.
Tier A assets receive condition-based monitoring and faster response protocols, reducing the unplanned downtime hours concentrated in the small group of assets that matter most.
Technician hours shift away from low-consequence assets toward the ones where a missed inspection actually carries operational or safety risk.
Stocking decisions are tied directly to criticality tier and lead time risk, rather than uniform safety stock rules applied across an entire warehouse.
A documented, scored criticality methodology gives insurers and auditors clear evidence of a structured reliability programme rather than an informal, undocumented prioritization process.
Mistakes That Quietly Undermine a Criticality Ranking Programme
A criticality matrix is only as useful as the discipline behind keeping it accurate. These are the patterns that most often cause a well-built initial matrix to drift out of sync with actual plant risk.
Criticality scores set during initial commissioning rarely get updated as equipment ages, redundancy changes, or new failure history accumulates — quietly making the ranking stale within a year or two.
When department heads can override criticality rankings informally to get their equipment prioritized, the matrix stops reflecting actual risk and starts reflecting whoever has the most organizational influence.
Ranking an entire system as one asset, rather than its individual critical components, hides the fact that one specific pump within a redundant system may carry far more risk than the system-level score suggests.
An asset with low standalone criticality can still be ranked too low if its failure would trigger a cascading trip across other systems — a risk that requires explicit cross-system review, not just isolated scoring.
A Practical Sequence for Building Your First Criticality Matrix
Rather than scoring all 1,000+ assets at once, begin with the equipment that drives the majority of production value or carries the highest safety exposure, proving the methodology before scaling plant-wide.
Production impact scoring is most accurate when operations leadership participates directly, since maintenance teams alone often underweight the downstream consequences of certain equipment failures.
Build an annual or semi-annual review of criticality scores into the programme from the start, rather than treating the initial scoring exercise as a one-time project that finishes when the spreadsheet is complete.
Asset Criticality Ranking on OxMaint — Common Questions
For a mid-size plant, building an initial criticality matrix typically takes two to three weeks, working with your reliability and operations leads to score each asset class against the five weighted factors. Large or multi-site plants may take longer depending on asset register complexity, but OxMaint's onboarding team handles the structured scoring workflow throughout. Sign up to start building your asset criticality matrix.
Yes. While OxMaint provides default weightings based on industry reliability standards, every factor weight can be adjusted to reflect your plant's specific risk tolerance, regulatory environment, and operational priorities. A cement plant and a power generation facility will weight production impact differently, and the system accommodates that. Book a demo to see weight customization in action.
Once an asset's criticality tier is established, OxMaint can apply the corresponding PM strategy template automatically — adjusting inspection frequency, condition monitoring requirements, and escalation rules. Planners retain full ability to override or fine-tune individual asset schedules where local knowledge suggests an adjustment. Sign up to configure tier-based PM templates for your asset classes.
Yes. OxMaint recalculates the failure history component of the criticality score as new breakdown data accumulates in the CMMS, so an asset's ranking reflects its actual track record rather than staying frozen at its initial theoretical assessment. This keeps the matrix accurate as equipment ages or operating conditions change. Book a demo to see how scores evolve with operating history.
OxMaint's criticality matrix is designed to complement, not replace, existing reliability-centered maintenance or FMEA work your team has already done. Failure mode data and consequence analysis from prior RCM studies can be imported directly into the asset scoring process, building on your existing reliability engineering investment rather than starting over. Sign up to integrate your existing RCM data.
Give Your Maintenance Team a Ranked List That Actually Reflects Risk
OxMaint builds a structured asset criticality matrix from safety, production, cost, and failure history data — then drives PM strategy, spares planning, and response priority automatically from that ranking.