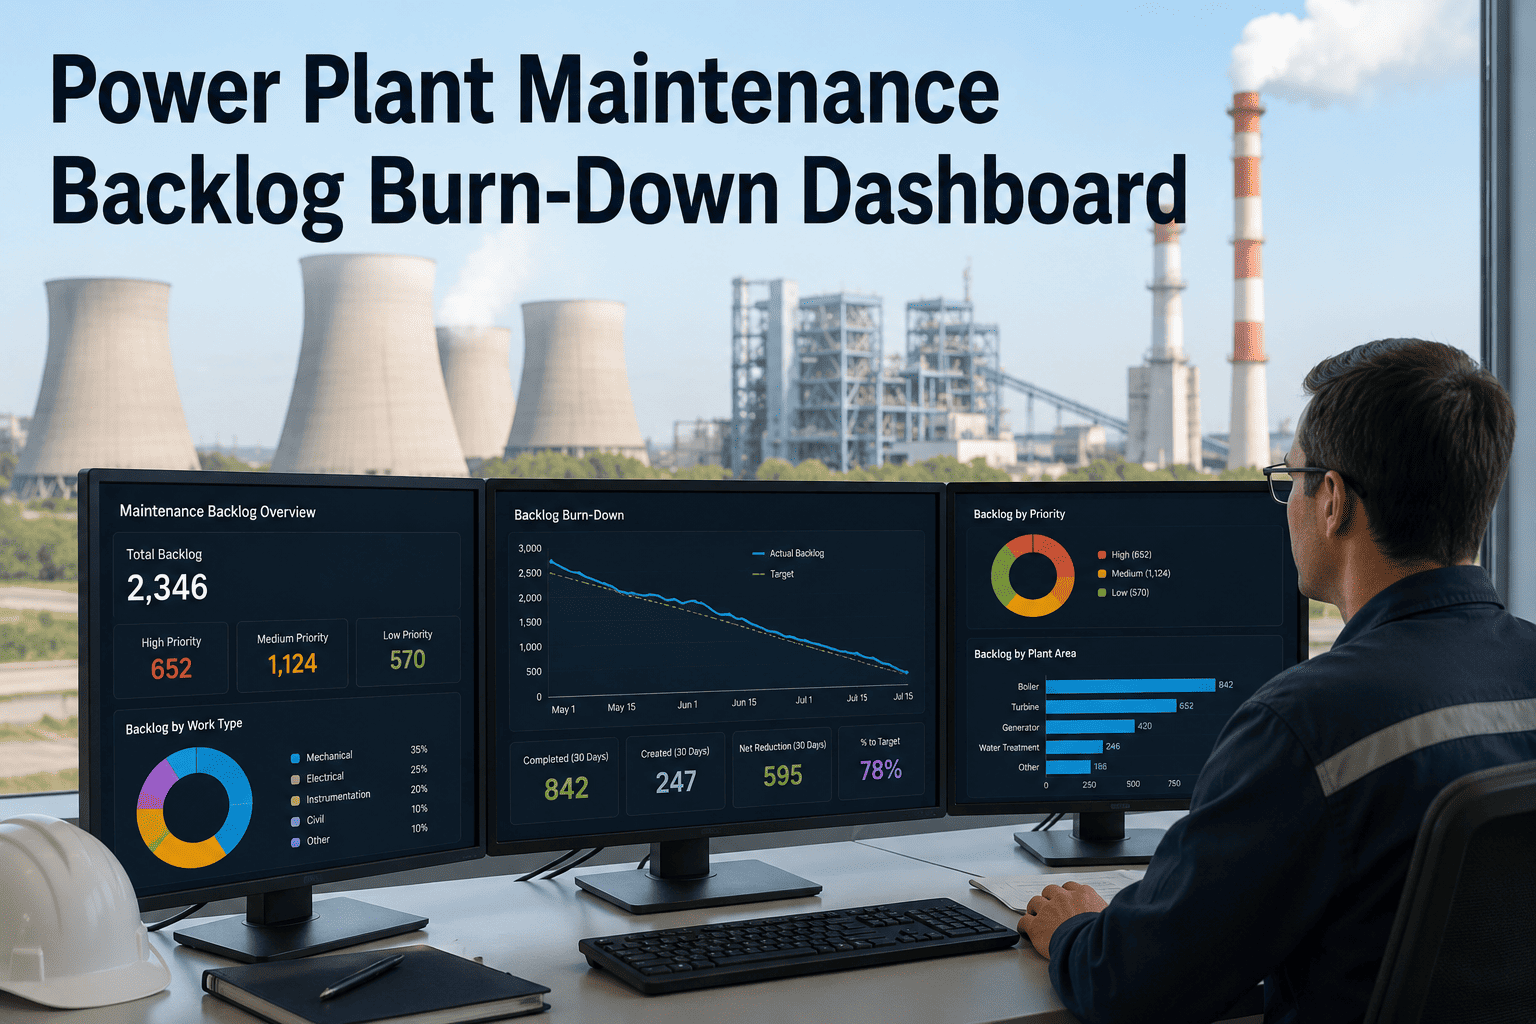
Every power plant carries a second backlog that never appears on the daily schedule — the pile of work that can only be done when a unit is offline. Between outages it grows quietly; during an outage it has to be cleared against a clock that does not stop. An outage backlog burn-down tracker turns that pile into a moving line you can watch fall day by day, so planners know on Day 3 whether they will finish on Day 10 or overrun. This page explains how the tracker works, what a healthy backlog looks like, and how Oxmaint's outage planning tools keep your burn-down on pace.
Outage Backlog Burn-Down Tracker for Power Plants
See remaining outage scope fall in real time, catch slippage on Day 3 instead of Day 9, and walk into every shutdown knowing exactly how much work stands between you and back-online.
What a Burn-Down Tracker Actually Shows
A burn-down chart plots remaining work hours against time. The straight ideal line is the pace you must hold to finish on schedule; the actual line is reality. When the actual line floats above ideal, you are behind — and the gap, spotted early, is still recoverable. Below is a ten-day outage burning down from 1,200 hours of scope.
The power of the tracker is timing. A team reading this chart on Day 4 sees the actual line sitting above ideal and can add a shift, pull a contractor, or reprioritize scope while there is still runway — instead of discovering the overrun when the unit was supposed to be back on the grid.
Measure the Pile in Weeks, Not Tickets
Counting open work orders is misleading — a five-minute inspection and a ten-hour gearbox rebuild each count as one. Healthy backlog is measured in weeks of labor: total pending hours divided by weekly crew capacity. Where your number lands tells you whether you are idle, healthy, or sliding toward a reactive spiral.
A buffer in the 2-4 week range keeps crews productive without letting work age. Heavier plants tied to shutdown cycles may run 4-6 weeks by design — but once the number pushes past six and keeps climbing, deferred work is compounding into real reliability risk.
The Three Buckets Behind the Number
A single backlog figure hides the detail that decides whether work is actually executable. High performers split the queue into three buckets so a planner always knows what is truly ready to schedule into the next window versus what is still stuck waiting on something.
Work that is identified but still needs scoping — materials, labor estimates, and method not yet defined. It cannot be scheduled until it is built out.
Fully scoped but not yet executable — held up by parts in transit, contractor availability, or special tools and access that are not confirmed.
Every part, resource, and approval is in place. This is the bucket that feeds the outage window, and the one your burn-down is actually clearing.
Turn Your Outage Pile Into a Live Burn-Down
Oxmaint tracks remaining hours against your outage timeline automatically, so the gap between plan and reality is visible the moment it opens — not on the day you were meant to restart.
The Phantom Backlog Problem
Before you trust any burn-down, the queue has to be clean. A large share of most backlogs is noise — and noise makes the chart lie, showing scope that does not really exist while masking the work that does.
Phantom backlog is the duplicate requests, capital projects miscoded as maintenance, and jobs physically completed but never closed in the system that quietly inflate your numbers. Old work orders sitting open past 90 days are the most common culprit. A burn-down tracker is only honest once a gatekeeping step filters new requests and stale items are purged — otherwise the line you are watching is measuring fiction.
What the Oxmaint Tracker Puts on Your Dashboard
Because every work order is logged at the point of work, the tracker calculates burn-down and backlog health live — no spreadsheet exports, no end-of-week reconciliation. Here is what planners and managers see at a glance.
Remaining outage hours plotted against the ideal pace, updated as crews close work so slippage surfaces the same day.
See exactly where the pile concentrates — which trade or unit is carrying the weight — so you load crews where it counts.
Know how much of the queue is genuinely schedulable versus still waiting on parts or access before the window opens.
Flag work orders aging past threshold and capture why jobs stalled, turning recurring delays into root causes you can fix.
Walk Into Your Next Outage on Pace
Stop reconstructing progress from memory and spreadsheets. See your ready backlog, burn-down pace, and aging work in one live view built for power plant outages.
Frequently Asked Questions
Clear the Pile With Confidence
A clean, live burn-down is the difference between a controlled outage and a costly overrun. Bring your outage backlog into one tracker and watch the line fall on schedule, window after window.