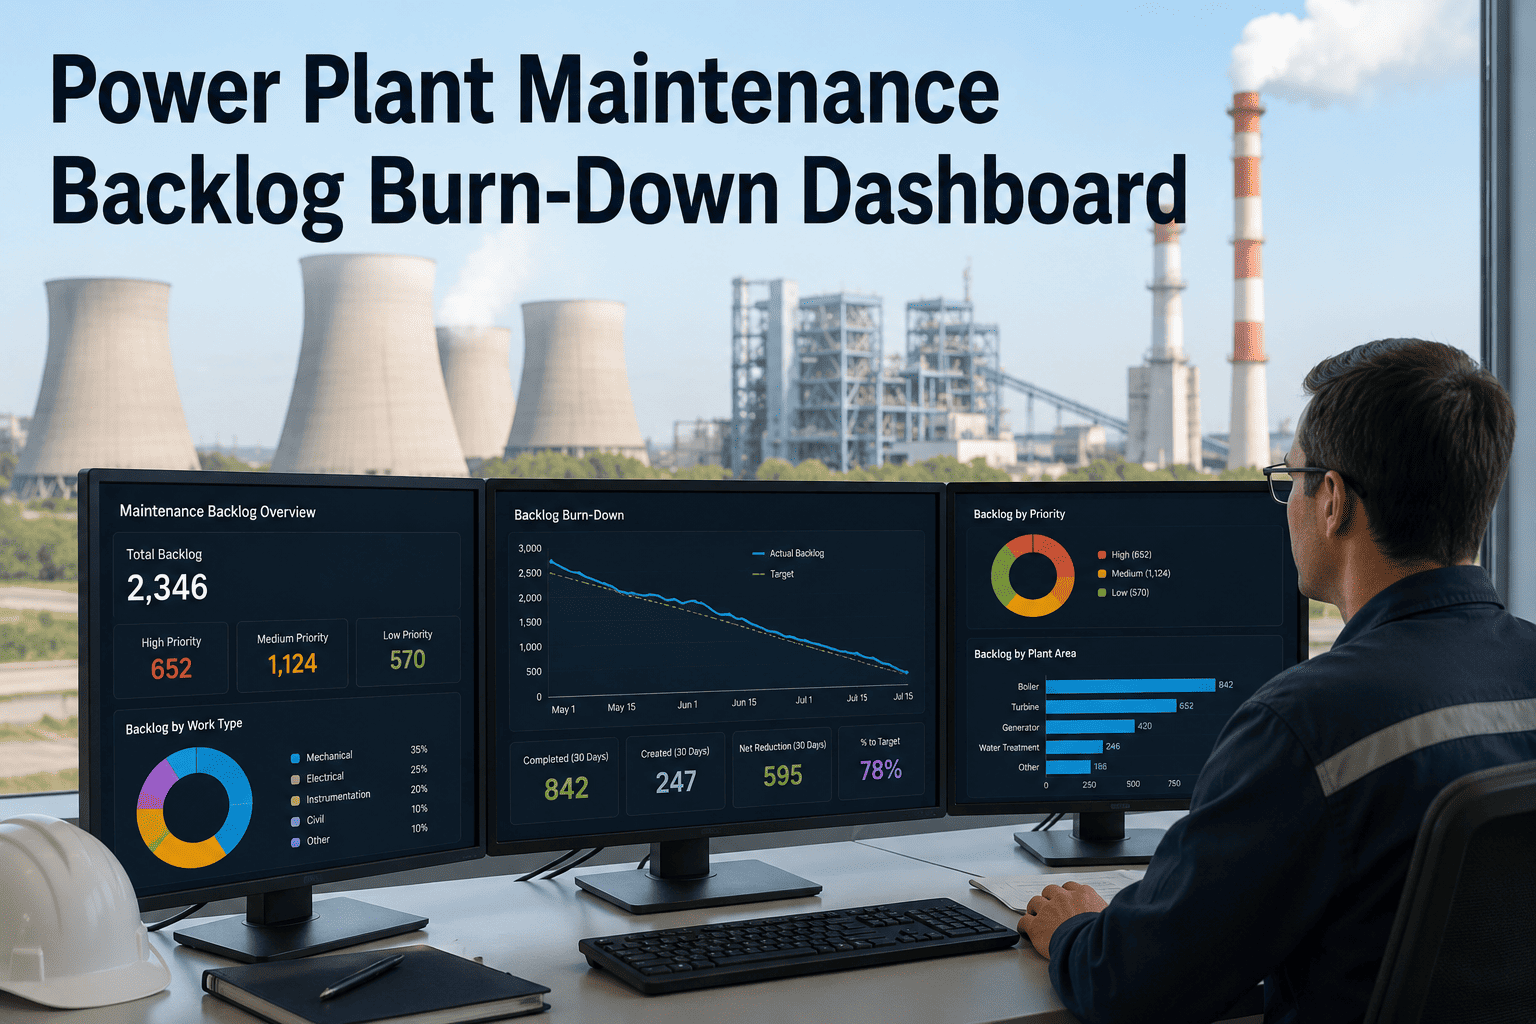
A growing maintenance backlog is one of the most reliable early warning signs that a power plant is heading toward a reliability crisis — but most maintenance managers cannot quantify their backlog's risk profile, let alone present it meaningfully to plant leadership. The backlog is not just a list of overdue work orders; it is a mix of deferred safety tasks, overdue PMs on critical rotating equipment, low-priority cosmetic jobs from three years ago, and work that cannot be executed until the next planned outage window. Treating all of it equally — or worse, not tracking it at all — means the crew is perpetually busy while the highest-risk deferrals keep aging. OxMaint's Analytics and Reporting module gives maintenance managers a backlog burn-down dashboard that does what spreadsheets cannot: it scores each deferred item by risk, maps it against crew capacity, filters by critical asset classification, and rolls it into an executive reliability report that leadership can act on. Start your free OxMaint trial and get your first priority-ranked backlog view in your first week, or book a 30-minute demo to see the dashboard on live plant data.
Maintenance Backlog — The Hidden Reliability Risk
69%
Of plants experience unplanned outages monthly from deferred maintenance
3–5×
Cost of reactive repair vs. planned maintenance on the same job
40–50%
Technician wrench time in reactive programs — vs. 65–75% with CMMS-managed backlog
15–20 hrs
Monthly time spent on manual backlog and compliance reporting
What a Backlog Dashboard Must Show — and What Most Systems Miss
A flat list of overdue work orders sorted by due date is not a backlog dashboard — it is a queue. A useful backlog dashboard answers four questions that a queue cannot: Which deferred items carry the highest failure consequence if they age another week? Is the current crew capacity sufficient to burn down the critical backlog before the next planned outage? Which assets are generating repeat deferrals that indicate a deeper reliability problem? And what does the backlog look like to a CFO or plant manager who needs to understand reliability risk without reading individual work orders?
OxMaint Backlog Dashboard Components
Priority View
Risk-Scored Backlog Queue
Every deferred work order scored by failure risk, asset criticality, PM compliance impact, and days overdue. One click shows all overdue critical-asset PMs sorted by consequence — not by creation date.
P1Critical — address this week
P2High — next outage window
P3Manageable — schedule forward
Capacity View
Crew Capacity vs. Backlog Load
Available crew hours mapped against the estimated hours in each priority tier — shows whether the backlog can be cleared in the current planning window or requires contractor support or outage scheduling.
Pattern View
Repeat-Deferral Asset Flags
Assets with three or more consecutive deferrals are flagged automatically — indicating either a resource constraint, a parts availability issue, or an underlying reliability problem that needs a root cause review, not another deferral.
OxMaint Analytics and Reporting
Turn Your Backlog Into a Burn-Down Plan — Not a Liability
Priority scoring, crew capacity mapping, and executive reliability reports — built from your live work order data. No spreadsheets. No manual aggregation. Ready for your next leadership meeting.
Overdue PM Classification — Not All Deferrals Carry the Same Risk
| PM Classification |
Example Tasks |
Max Safe Deferral |
Consequence if Overdue |
Backlog Action |
| Safety-Critical PM |
PRV test, isolation valve function, fire suppression check |
Zero tolerance |
Regulatory violation + safety incident risk |
Escalate immediately — P1 |
| Reliability-Critical PM |
Turbine bearing inspection, generator H₂ check, HRSG tube scan |
2–4 weeks |
High forced outage probability |
Schedule within current window — P1/P2 |
| Compliance-Tracked PM |
NERC-required inspections, EPA reporting tasks |
Per regulatory schedule |
Audit finding, potential penalty |
Track to regulatory deadline — P2 |
| Routine Maintenance |
Lubrication routes, filter changes, belt checks on non-critical assets |
2–6 weeks |
Gradual efficiency loss |
Schedule in next available window — P3 |
The Executive Reliability Report — What Plant Leadership Actually Needs
Most maintenance teams struggle to present backlog risk to plant leadership in a format that drives budget and resource decisions. A spreadsheet of 400 overdue work orders communicates urgency, not insight. Leadership needs to understand risk exposure, resource gaps, and the cost of continued deferral — in the same language they use to evaluate every other capital decision.
OxMaint's executive reliability report takes live backlog data and converts it into three leadership-ready metrics: reliability risk score by asset class, estimated cost exposure from critical-tier deferrals, and crew capacity utilization rate. A maintenance manager can walk into a budget review with a two-page report generated in minutes — not a three-week manual assembly project.
Reliability Risk Score
Overall asset fleet health scored by critical PM compliance rate, overdue high-consequence items, and repeat-deferral asset count. Benchmarkable across plants in the same fleet.
Deferred Maintenance Cost Exposure
Critical and high-tier backlog items translated into estimated failure cost exposure — the financial risk of continued deferral in terms the CFO understands without reading work order descriptions.
Crew Capacity Utilization
Percentage of available crew hours consumed by backlog burn-down vs. new PM work vs. reactive repairs — shows whether the current team size is adequate to maintain the asset fleet at target compliance.
Frequently Asked Questions
How does OxMaint determine the priority score for backlog items?
Priority scoring uses four inputs: the asset's criticality classification (which is set by the maintenance team during asset setup), the PM type (safety-critical, reliability-critical, or routine), the number of days overdue, and any live sensor data indicating current asset condition. Safety-critical overdue PMs are automatically escalated to P1 regardless of other factors.
Start your trial to set up your asset criticality classifications from day one.
Can the backlog dashboard be filtered by specific asset class or unit?
Yes. OxMaint's backlog view supports filtering by unit, asset class, PM type, priority tier, and assigned crew. A reliability engineer can pull a turbine-only backlog view, and a shift supervisor can see only the work assigned to their crew and executable in their available hours — without seeing the full plant queue.
Book a demo to walk through the filter and reporting options for your plant structure.
How does OxMaint handle work that cannot be executed until a planned outage window?
Work requiring unit shutdown is tagged at creation with a "planned outage required" flag and held in a separate outage-gated queue. When an outage is scheduled in OxMaint, all qualifying backlog items are automatically surfaced for scope inclusion — so the outage planning team sees every deferrable item that needs to be addressed, not just the items anyone remembers to add manually.
How is the executive reliability report formatted for leadership presentations?
The OxMaint executive report exports as a structured PDF with a reliability risk summary, backlog priority breakdown by tier, crew capacity chart, and cost exposure table. It is designed for a plant manager or CFO review — no maintenance background required to understand the risk picture. Generation takes under two minutes from live data with no manual formatting.
OxMaint for Maintenance Planning
Every Week of Unmanaged Backlog Is a Week Closer to the Next Forced Outage
P1 First
risk-scored queue — your highest-consequence items always at the top
2 min
to generate an executive reliability report from live backlog data
65–75%
technician wrench time with OxMaint-managed scheduling vs. 40–50% reactive
OxMaint gives maintenance managers the priority scoring, capacity mapping, and reporting tools to turn a growing backlog into a managed burn-down plan — before a deferral becomes a forced outage.