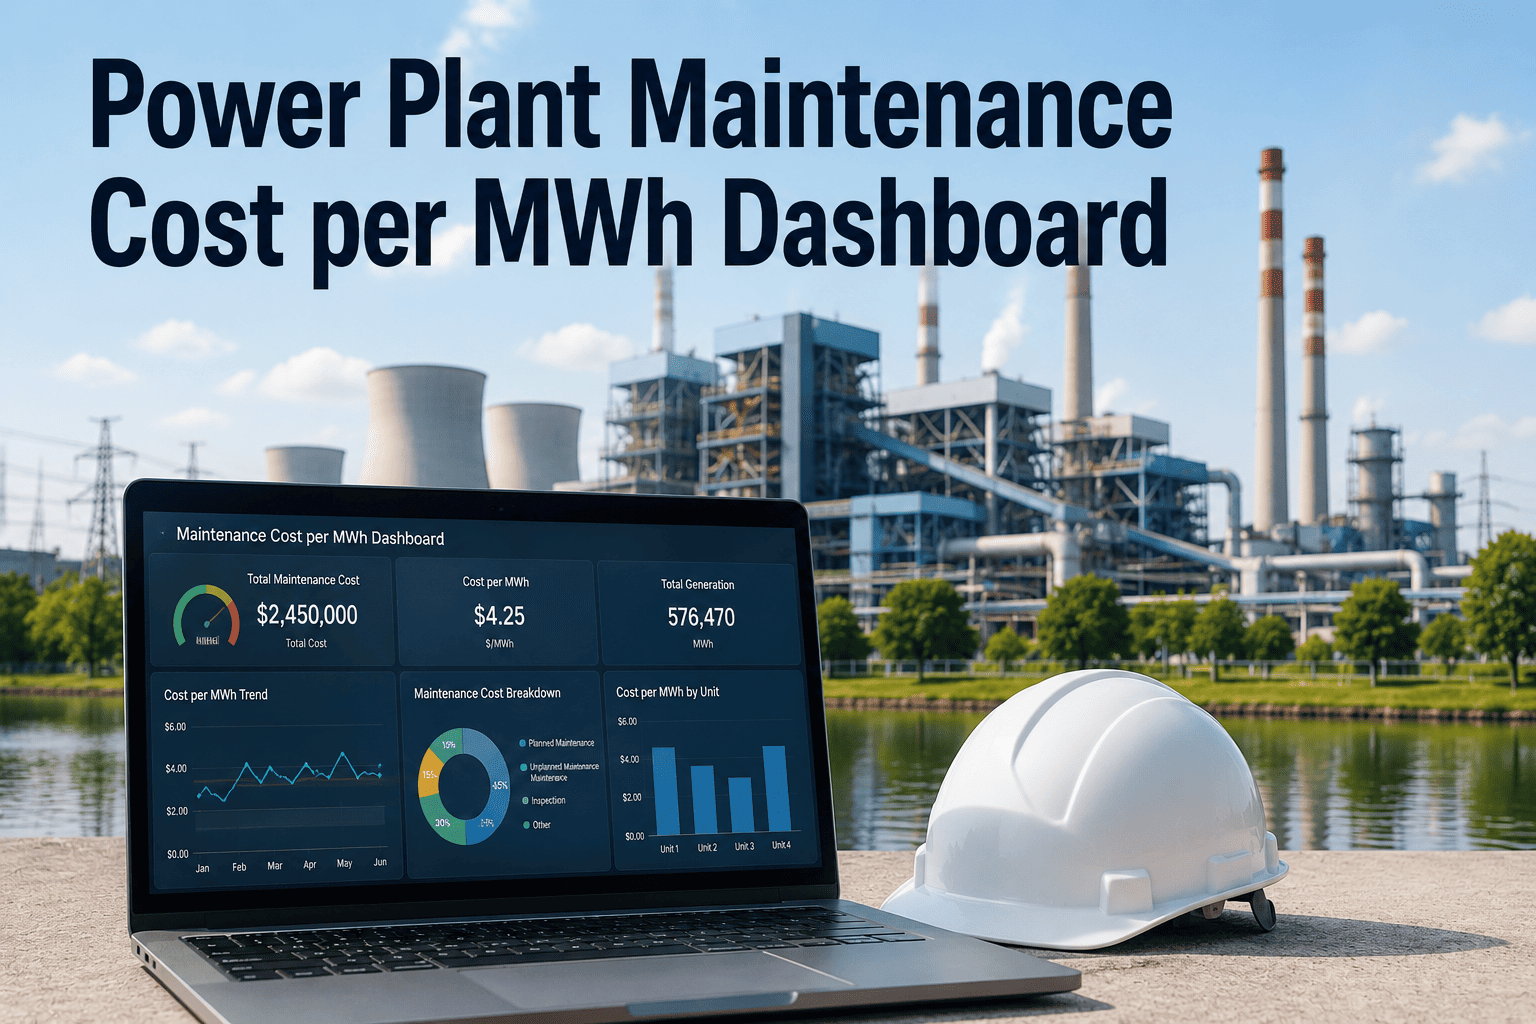
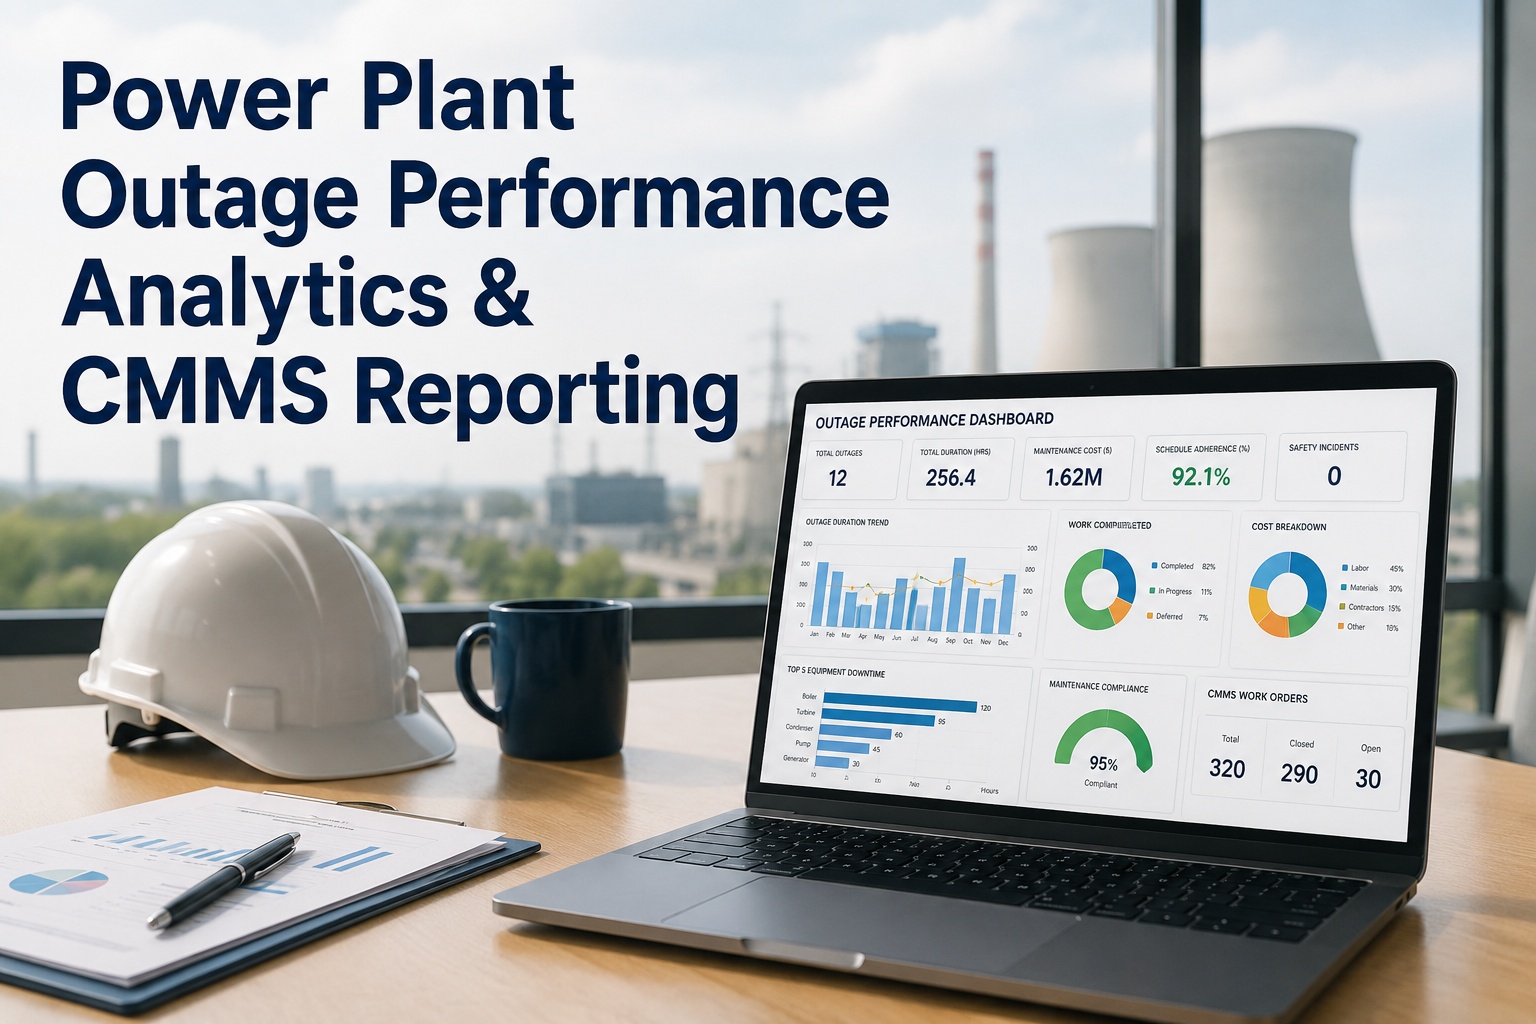
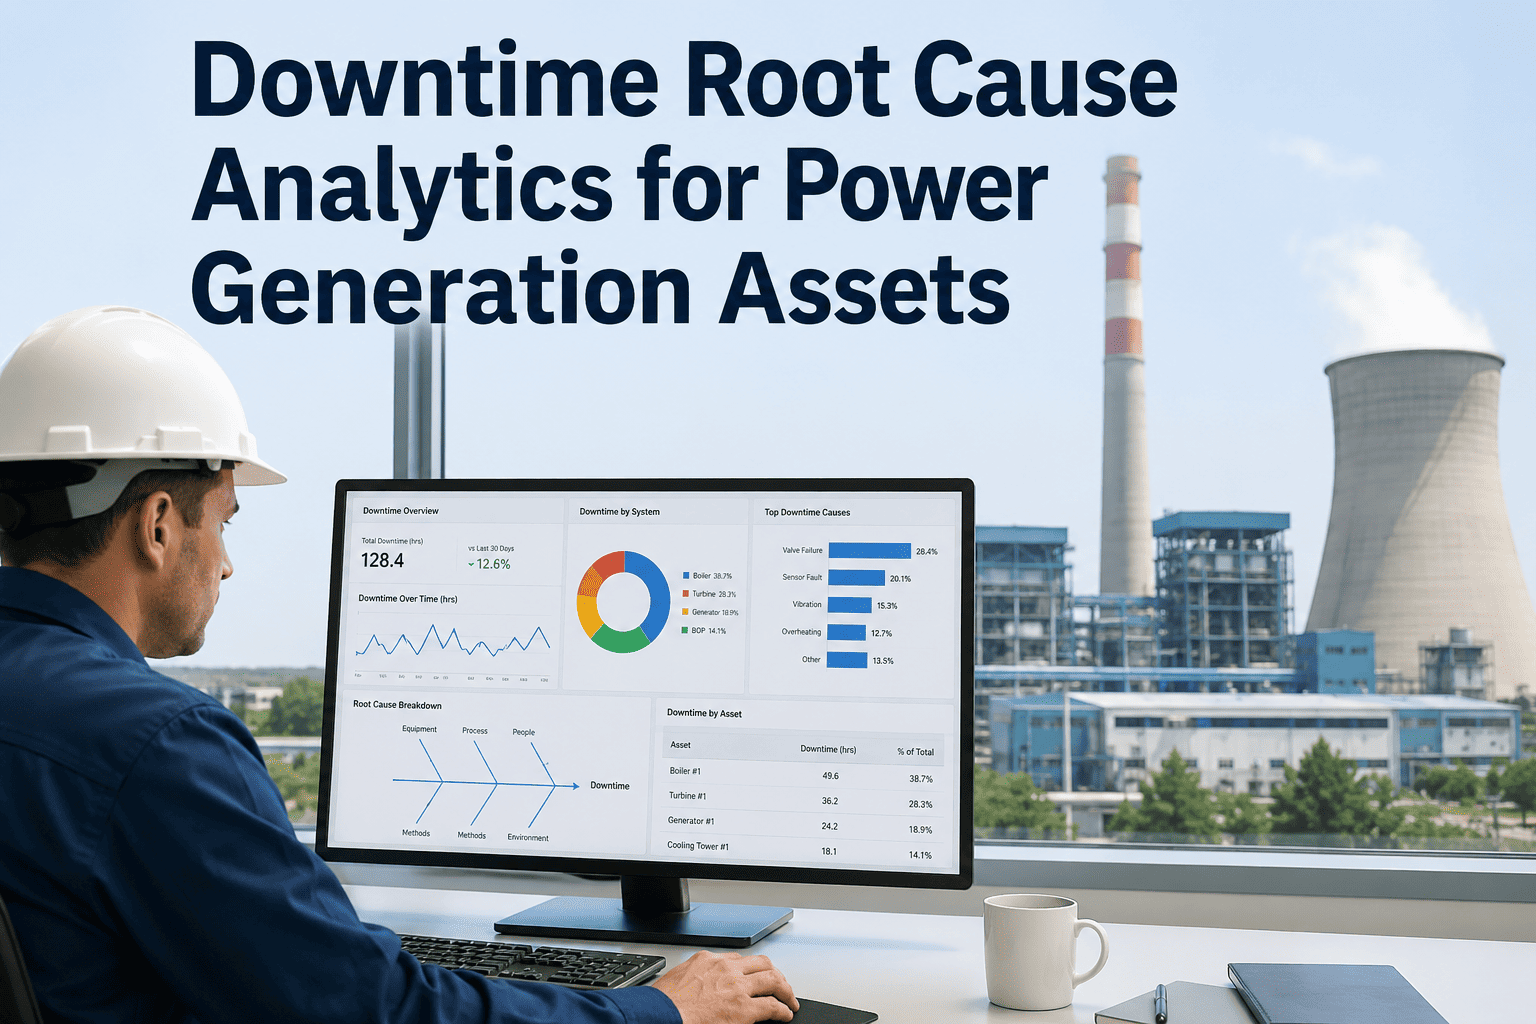
Maintenance cost per MWh is the single number that tells leadership whether your maintenance program is creating value or quietly eating margin. Operations and maintenance expenses can represent 20-25% of the total cost per kWh produced over a generating asset's lifetime, yet many plants still calculate this figure manually, once a quarter, from spreadsheets that blend fuel costs with maintenance spend and leave out lost-generation costs entirely. OxMaint's Maintenance Cost per MWh Dashboard calculates this KPI continuously from live work order, labor, parts, and downtime data, broken down by unit, asset class, and maintenance type. Book a demo to see your cost-per-MWh trend in real time.
Feature · Analytics & Reporting
Power Plant Maintenance Cost per MWh Dashboard
20-25%
of lifetime generation cost is typically O&M expense
80%
industry benchmark for planned vs. total maintenance hours
15-30%
how much manual logging underestimates MTTR, distorting cost figures
Cost Breakdown
What Goes Into Your Maintenance Cost per MWh
Labor 35%
Parts 30%
Contractor 20%
Lost Generation 15%
Labor — internal crew hours and overtime
Parts — spares, consumables, and inventory carrying cost
Contractor — outsourced labor and specialist services
Lost Generation — revenue impact of unplanned downtime
Core KPIs
The Five KPIs Behind the Cost-per-MWh Number
Maintenance Cost per MWh
Primary financial efficiency metric
Combines labor, parts, contractor spend, and lost-generation cost from downtime, normalized to MWh generated across the reporting period.
MTBF
Higher is better
Mean time between failures per critical asset class. A rising trend is the clearest sign your PM program is working.
MTTR
Lower is better
Mean time to repair, from fault logged to asset fully operational, including diagnosis, parts, repair, and testing.
PM Compliance Rate
Target: above 90%
Percentage of scheduled preventive maintenance tasks completed on time, by asset, crew, and area.
Forced Outage Rate
Lower is better
Frequency of unplanned outages per unit per year, the main driver of the lost-generation cost component above.
Stop Calculating Cost per MWh From Last Quarter's Spreadsheet
OxMaint pulls labor, parts, contractor, and downtime data automatically so your cost-per-MWh figure updates continuously, not quarterly.
Role-Based Views
The Same Data, Tailored to Every Role
Executive View
$/MWh Trend
Quarter over quarter
Forced Outage Rate
Per unit, per year
Planned vs Reactive
Target 80% planned
Maintenance Manager View
Backlog Hours
Vs. available crew capacity
Aged Critical WOs
Overdue, flagged for action
First-Time Fix Rate
Closed without repeat in 30 days
Technician View
Today's Work Orders
Assigned by priority
Parts Availability
For assigned tasks
PM Due This Week
By asset and area
Benchmarks
KPI Benchmarks OxMaint Tracks Automatically
| KPI |
Industry Benchmark |
What Drives It |
OxMaint Tracking |
| Maintenance Cost per MWh |
Plant-specific, trending down year over year |
Labor, parts, contractor spend, lost generation |
Calculated continuously from live work order and downtime data |
| PM Compliance Rate |
Above 90% |
On-time completion of scheduled PM tasks |
Automatic tracking with overdue alerts |
| Planned vs Reactive Ratio |
80% planned or better |
Share of WO hours that are planned vs emergency |
Per-asset and per-crew breakdown |
| MTTR |
Plant and asset specific, minimize |
Diagnosis, parts sourcing, repair, and test time |
Automatic timestamps across the WO lifecycle |
| Forced Outage Rate |
Plant and unit specific, minimize |
Frequency of unplanned outages per year |
Linked directly to the lost-generation cost component |
Industry Insight
Why Manual Tracking Distorts the Cost-per-MWh Picture
Non-fuel O&M per MWh is deliberately calculated without fuel costs, since fuel price swings can mask real operational improvements or problems, which is why a clean, automated maintenance cost feed matters for trend accuracy.
Based on utility O&M cost benchmarking guidance
Organizations relying on manual work order logging tend to underestimate MTTR by 15-30% because technicians log completion times rather than actual repair start times, which quietly understates the labor and downtime components of cost per MWh.
Based on power plant maintenance KPI benchmarking research
FAQs
Frequently Asked Questions
What is included in maintenance cost per MWh?
It combines internal labor, spare parts and consumables, contractor and specialist services, and the revenue impact of lost generation from downtime, normalized against total MWh generated.
Start free to see your own breakdown.
How does OxMaint calculate this KPI in real time?
OxMaint connects to work order, labor, inventory, and downtime data through REST API, OPC-UA, OSIsoft PI, and Modbus, recalculating cost per MWh continuously rather than from periodic manual exports.
Why does the planned-to-reactive ratio matter for cost per MWh?
Reactive work typically costs more per hour than planned work and is more likely to involve lost generation, so a plant below the 80% planned benchmark usually has a higher cost per MWh than its peers.
Can the dashboard be customized for different roles?
Yes. Plant managers and reliability engineers can set custom KPI targets, alert thresholds, date ranges, and add or remove tiles for each role's home view.
How long does it take to get the cost-per-MWh dashboard live?
Most integration configurations are complete within 2 to 3 weeks. Plants already using OxMaint CMMS have the dashboard active from day one.
Book a demo to see it with your data.
Analytics & Reporting
See Your True Maintenance Cost per MWh — Updated Continuously
OxMaint turns labor, parts, contractor, and downtime data into one live KPI, broken down by unit, asset, and maintenance type.